 Maradok
Kereskedési feltételek
Products
Eszkozok


The EUR/USD pair finally settled down on Wednesday, and the market situation "stabilized." Volatility returned to familiar levels for everyone, that is, to low levels. Yes, we saw a nice surge of emotions at the end of last week and the beginning of this one, but what next? Will the pair again trade at 30-40 pips a day? If yes, then this is bad news for traders.
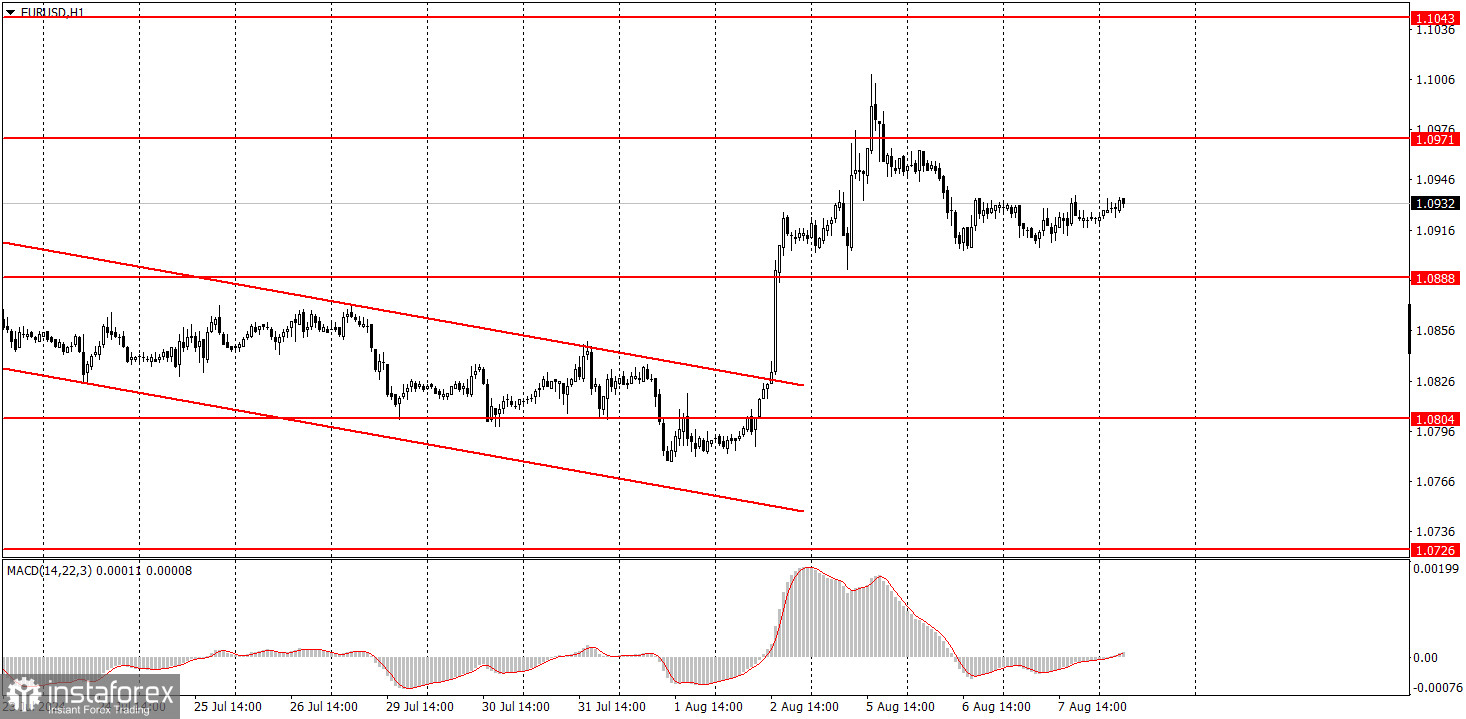
Yesterday, the only notable macroeconomic data was the report on industrial production in Germany. This indicator for June was slightly above forecasts, but it had practically no impact on the pair's movement due to its weak significance for the market. There was no other news or events. Thus, we saw a sharp rise in the euro, followed by a correction. There are no grounds for a new rise in the euro. The single currency rebounded from the upper line of the horizontal channel 1.0600-1.1000, so it would be logical for the pair to move towards the lower boundary.
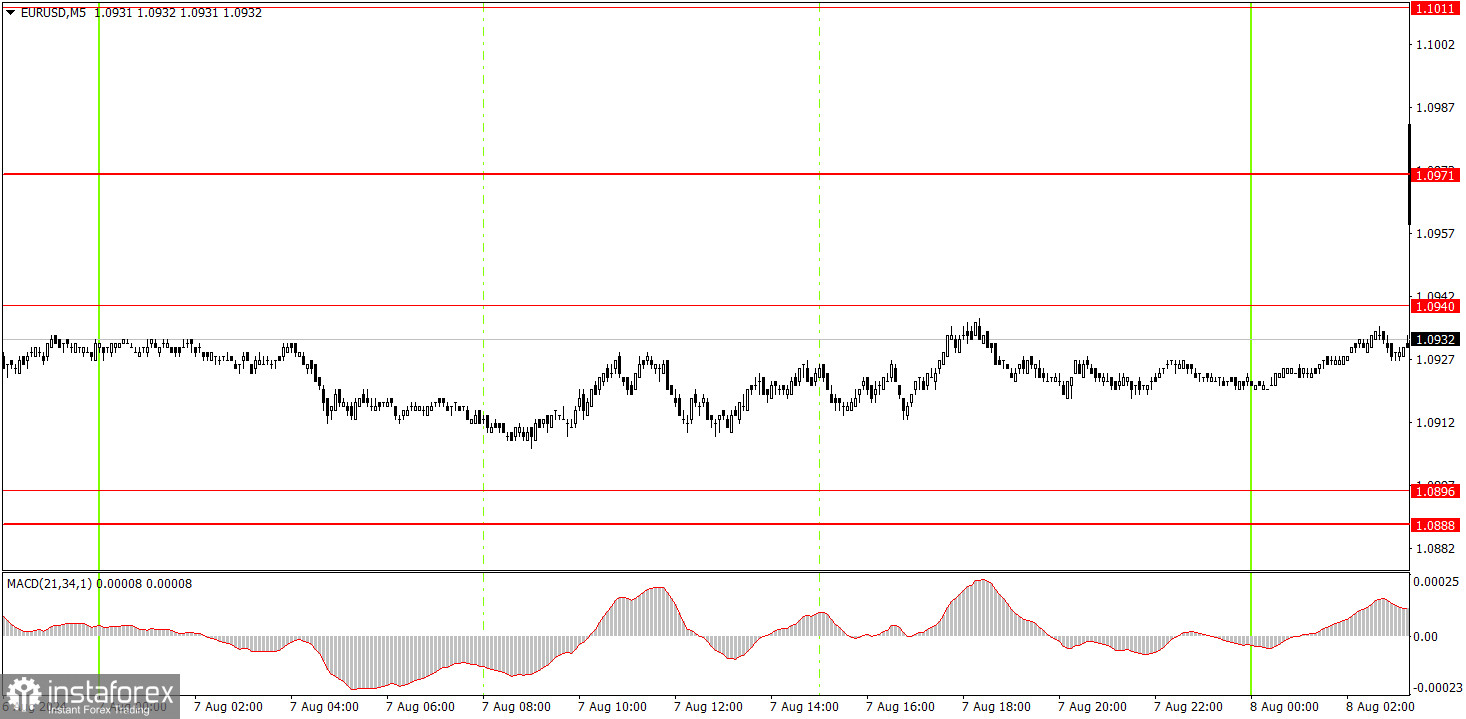
No trading signal was formed in the 5-minute time frame on Wednesday. The good days are over. Volatility is back to zero, and one signal a day is now considered lucky. We don't even talk about the quality of such signals because it's evident that if there are no movements in the market, any signals won't bring good profits.
EUR/USD sharply increased and broke the short-term downward trend in the hourly time frame. We believe the euro has fully factored in all the bullish factors, so we do not expect the upward movement to continue. The 24-hour time frame remains flat in the 1.06-1.10 range. There are currently no reasons to leave this range. As before, we only anticipate a decline in the euro, but the market again demonstrates by its actions that it is ready to seize any opportunity to sell the dollar.
On Thursday, novice traders can trade from 1.0940. However, volatility has already significantly decreased and is unlikely to increase on Thursday and Friday.
The key levels to consider on the 5M timeframe are 1.0526, 1.0568, 1.0611, 1.0678, 1.0726-1.0733, 1.0797-1.0804, 1.0838-1.0856, 1.0888-1.0896, 1.0940, 1.0971, 1.1011, 1.1043, 1.1091. The only report scheduled for Thursday is the U.S. unemployment claims—a secondary report. We continue to await the recovery of the U.S. dollar.
1) The strength of a signal is determined by the time it took for the signal to form (bounce or level breakthrough). The shorter the time required, the stronger the signal.
2) If two or more trades around a certain level are initiated based on false signals, subsequent signals from that level should be ignored.
3) In a flat market, any currency pair can produce multiple false signals or none at all. In any case, it's better to stop trading at the first signs of a flat market.
4) Trades should be opened between the start of the European session and mid-way through the U.S. session. All trades must be closed manually after this period.
5) In the hourly time frame, trades based on MACD signals are only advisable amidst substantial volatility and an established trend, confirmed either by a trendline or trend channel.
6) If two levels are too close to each other (from 5 to 20 pips), they should be considered as a support or resistance zone.
7) After moving 15 pips in the intended direction, the Stop Loss should be set to break-even.
Support and Resistance price levels: targets when opening long or short positions. You can place Take Profit levels near them.
Red lines represent channels or trend lines that depict the current trend and indicate the preferred trading direction.
The MACD (14,22,3) indicator, encompassing both the histogram and signal line, acts as an auxiliary tool and can also be used as a source of signals.
Important speeches and reports (always noted in the news calendar) can profoundly influence the price dynamics. Hence, trading during their release calls for heightened caution. It may be reasonable to exit the market to prevent abrupt price reversals against the prevailing trend.
Beginners should always remember that not every trade will yield profit. Establishing a clear strategy, coupled with effective money management, is key to long-term success in trading.
InstaForex analytical reviews will make you fully aware of market trends! Being an InstaForex client, you are provided with a large number of free services for efficient trading.


