 Maradok
Kereskedési feltételek
Products
Eszkozok


The EUR/USD currency pair showed a decent downward movement on Monday, continuing the trend for the second consecutive day. Recall that a drop in the US dollar was expected on Friday, as it is difficult to call the US macroeconomic data strong. If the unemployment rate did decline, the number of Non Farms came in below forecasts again. Therefore, it was a surprise to see the dollar strengthen. On Monday, however, there was no macroeconomic or fundamental background. And the fact that the market bought the dollar is a positive sign for us.
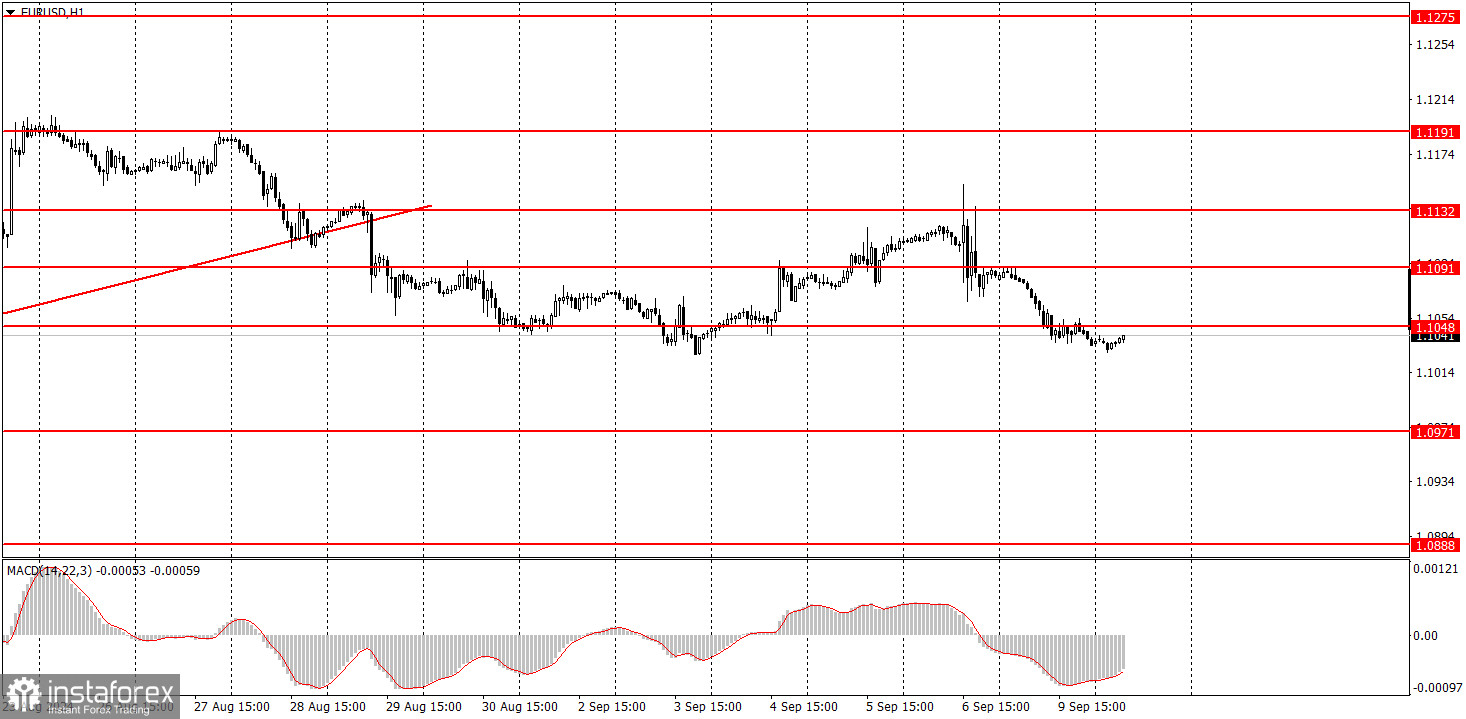
The price has not managed to break through its last local low, but upon reaching it, it did not shoot back up either. Thus, at least until the release of the US inflation report, we can expect a continuation of the fall. A decline in the medium term is the only logical and natural option.
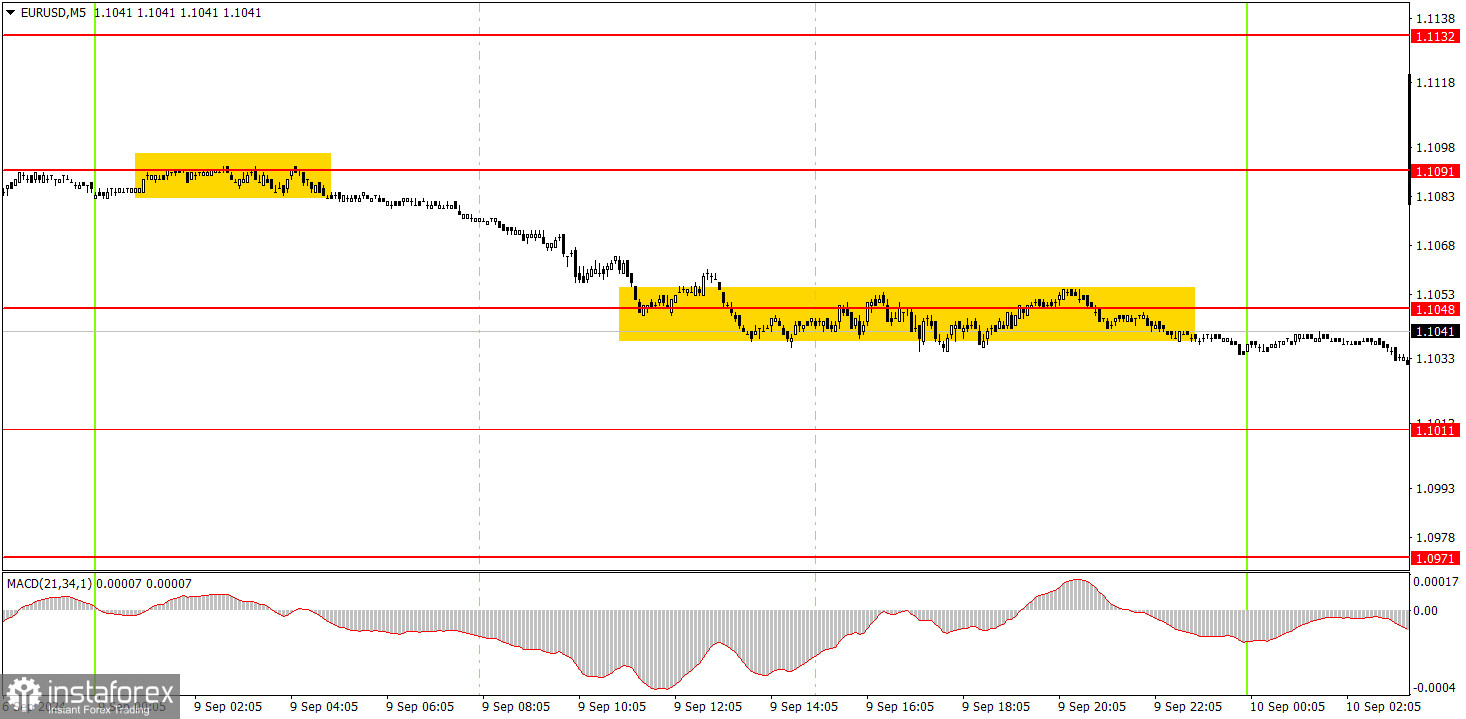
One decent trading signal formed overnight in the 5-minute time frame on Monday. The price bounced off the 1.1091 level, after which it dropped to the 1.1048 level, around which it traded flat for the rest of the day. Therefore, novice traders could have opened short positions at the opening of the European trading session and closed them around the 1.1048 level. Breaking through the 1.1048 level allows for opening new short positions.
In the hourly time frame, the EUR/USD pair has consolidated below the ascending trend line and, for the first time in a long while, has a chance to form a downward trend that would be logical and consistent with all factors and types of analysis. Unfortunately, illogical dollar sales could quickly resume, as no one knows how long the market will continue to price in the Federal Reserve's monetary policy easing, which has yet to start. The market continues to price in almost all future rate cuts by the Fed, and US macroeconomic data often disappoint rather than please.
On Tuesday, novice traders can expect a new, cautious decline as the market seems ready for a correction. However, the price needs to remain below 1.1048.
The key levels to consider on the 5M time frame are 1.0726-1.0733, 1.0797-1.0804, 1.0838-1.0856, 1.0888-1.0896, 1.0940, 1.0971, 1.1011, 1.1048, 1.1091, 1.1132, 1.1191, and 1.1275-1.1292. Tuesday only has one scheduled report—the second estimate of inflation in Germany for August. This report can be considered secondary and should not be expected to provoke a strong market reaction.
1) The strength of a signal is determined by the time it takes for the signal to form (bounce or level breakthrough). The less time it took, the stronger the signal.
2) If two or more trades were opened around any level due to false signals, subsequent signals from that level should be ignored.
3) In a flat market, any currency pair can form multiple false signals or none at all. In any case, it's better to stop trading at the first signs of a flat market.
4) Trades should be opened between the start of the European session and midway through the U.S. session. After this period, all trades must be closed manually.
5) In the hourly time frame, trades based on MACD signals are only advisable amidst good volatility and a trend confirmed by a trendline or trend channel.
6) If two levels are too close to each other (5 to 20 pips), they should be considered a support or resistance area.
7) After moving 15 pips in the intended direction, the Stop Loss should be set to break even.
Support and Resistance price levels: targets for opening long or short positions. You can place Take Profit levels around them.
Red lines: channels or trend lines that depict the current trend and indicate the preferred trading direction.
The MACD indicator (14,22,3): encompassing both the histogram and signal line, acts as an auxiliary tool and can also be used as a source of signals.
Important speeches and reports (always noted in the news calendar) can profoundly influence the movement of a currency pair. Hence, trading during their release calls for heightened caution. It may be reasonable to exit the market to avoid sharp price reversals against the prevailing movement.
For beginners, it's important to remember that not every trade will yield profit. Developing a clear strategy and effective money management is key to success in trading over the long term.
InstaForex analytical reviews will make you fully aware of market trends! Being an InstaForex client, you are provided with a large number of free services for efficient trading.


