 Maradok
Kereskedési feltételek
Products
Eszkozok


Trend-following analysis
This week, from the level of 1.3318 (close of the last weekly candle), the price may start moving down towards 1.3240 – the 14.6% retracement level (red dashed line). Upon reaching this line, the instrument is likely to begin moving up towards 1.3339 – the upper fractal (yellow dashed line).
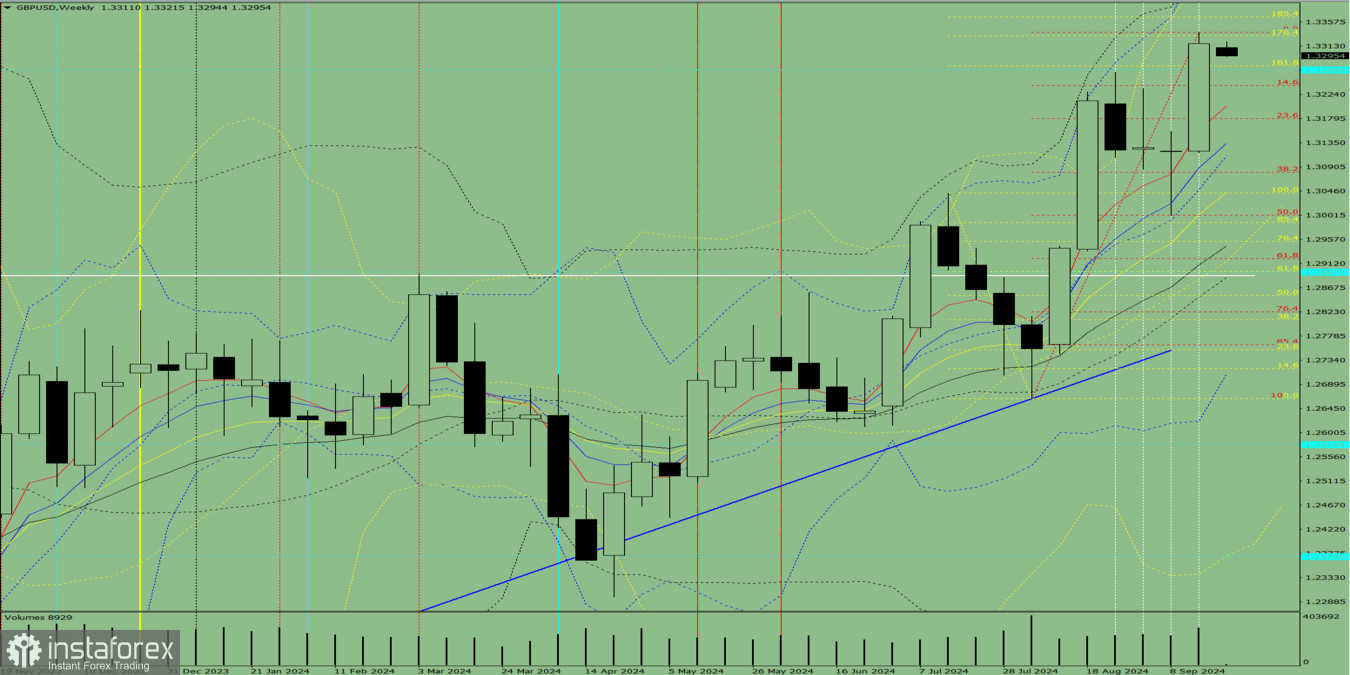
Figure 1 (weekly chart)
Complex analysis
Indicator analysis – down
Fibonacci levels – down
Trade volume – down
Candlestick analysis – down
Trend-following analysis – down
Bollinger Bands – up
Monthly chart – up
Conclusion from complex analysis: downward movement.
Overall summary of GBP/USD on weekly chart
This week, the price will likely follow a downtrend, due to the absence of the first upper shadow on the weekly black candle (Monday – down) and the presence of the second lower shadow (Friday – up).
This week, from the level of 1.3318 (close of the last weekly candle), the price may start moving down towards 1.3240 – the 14.6% retracement level (red dashed line). Once this level is reached, the instrument is likely to begin moving up towards 1.3339 – the upper fractal (yellow dashed line).
Alternative scenario. From the level of 1.3318 (close of the last weekly candle), the instrument may start moving down towards 1.3240 – the 14.6% retracement level (red dashed line). Upon reaching this line, the price will likely continue moving down towards 1.3179 – the 23.6% retracement level (red dashed line).
InstaForex analytical reviews will make you fully aware of market trends! Being an InstaForex client, you are provided with a large number of free services for efficient trading.


