 Maradok
Kereskedési feltételek
Products
Eszkozok


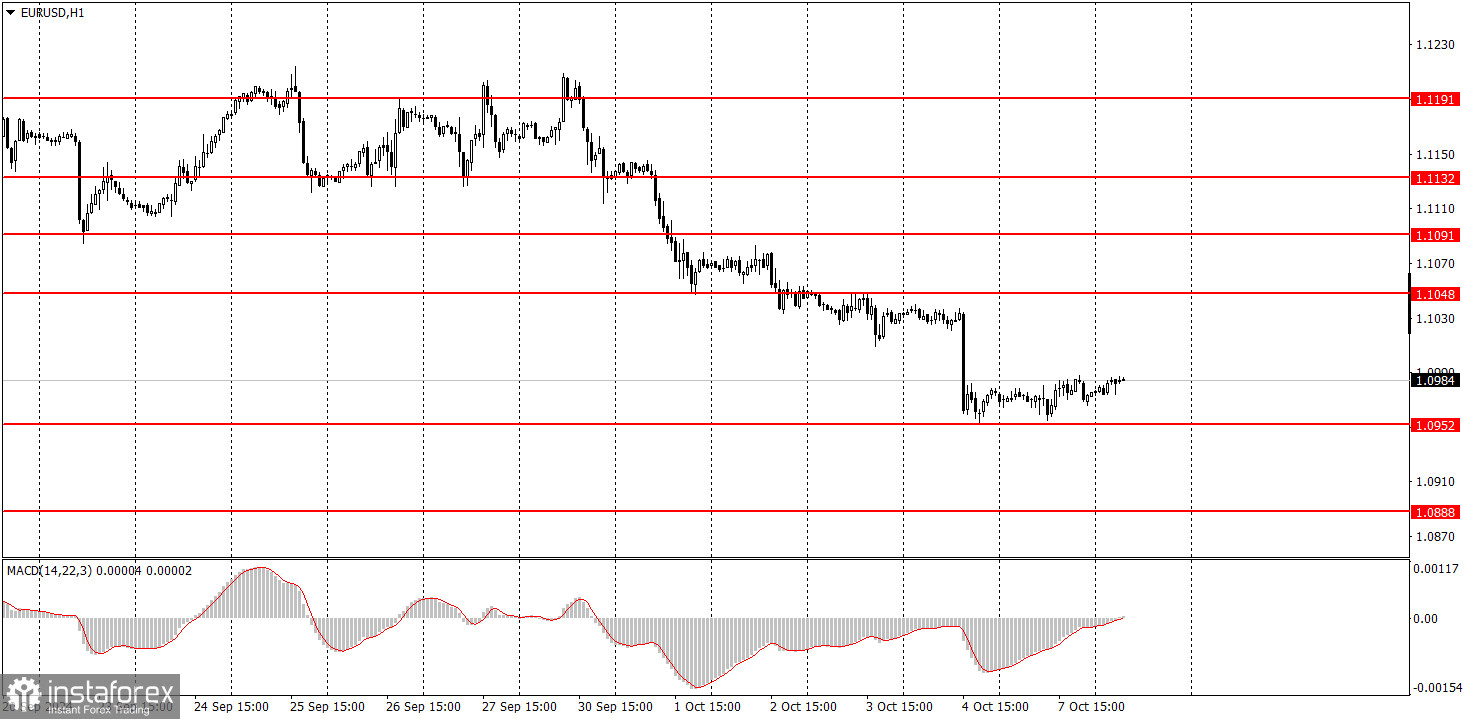
On Monday, the EUR/USD currency pair showed no significant movement. The daily volatility barely exceeded 30 pips, so we can say there were no actual movements. Throughout the day, only one somewhat notable report was released – on retail sales in the Eurozone. Retail sales volumes grew by 0.2% month-on-month, as forecasted. As a result, the market had little to react to. The euro found support near the 1.0950 level and may start correcting from there. As mentioned, this week's only major event will be the U.S. inflation report. At least until that report, the pair can correct calmly, though volatility may remain low. We believe a new downtrend has begun, which could last at least one or two months. The market needs to be sure that the Federal Reserve won't lower rates faster than the scheduled pace. In this case, the dollar will likely continue to strengthen in the medium term.
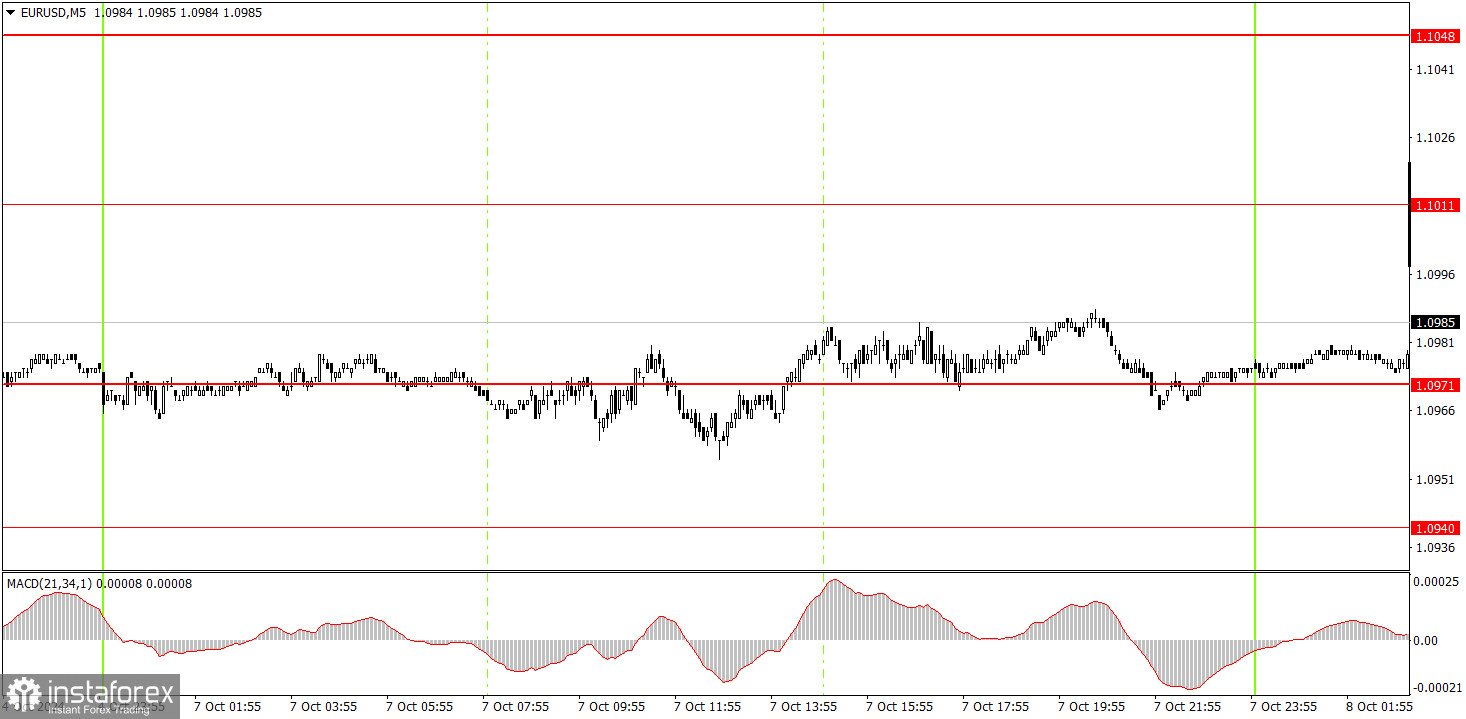
In the 5-minute time frame (TF) on Monday, the price crossed the 1.0971 level several times, which we adjusted to 1.0951. Since the market was flat all day, it was not advisable to enter the market. Novice traders may have tried to work with any signals during the European session when it wasn't entirely clear that there would be a flat market. However, they likely neither gained nor lost profits because the pair remained stagnant throughout the day.
Last week, the EUR/USD pair took a significant step towards a new downtrend in the hourly time frame. Unfortunately, further dollar selling could resume in the medium term, as no one knows how long the market will react to the Fed's easing monetary policy. However, on the hourly TF, there is still a downtrend. After a correction, further declines in the euro are expected.
You can trade from the 1.0951 level on Tuesday. Since the euro has been falling for five consecutive days, a correction seems quite reasonable this week, so be prepared for a slight rise.
In the 5-minute TF, consider the following levels: 1.0726-1.0733, 1.0797-1.0804, 1.0838-1.0856, 1.0888-1.0896, 1.0940, 1.0951, 1.1011, 1.1048, 1.1091, 1.1132-1.1140, 1.1189-1.1191, 1.1275-1.1292. No significant events are scheduled for Tuesday in the Eurozone or the U.S., so volatility will likely remain low, and price movements may be sluggish.
Support and Resistance Price Levels: These levels serve as targets when opening buy or sell positions. They can also be used as points to set Take Profit levels.
Red Lines: These represent channels or trend lines that display the current trend and indicate the preferred trading direction.
MACD Indicator (14,22,3): The histogram and signal line serve as an auxiliary indicator that can also be used as a source of trading signals.
Important Speeches and Reports (always found in the news calendar) can significantly impact the movement of a currency pair. Therefore, trading should be done with maximum caution during their release, or you may choose to exit the market to avoid a sharp price reversal against the preceding movement.
For Beginners Trading on the Forex Market: It's essential to remember that not every trade will be profitable. Developing a clear strategy and practicing money management is key to achieving long-term success in trading.
InstaForex analytical reviews will make you fully aware of market trends! Being an InstaForex client, you are provided with a large number of free services for efficient trading.


