 Maradok
Kereskedési feltételek
Products
Eszkozok


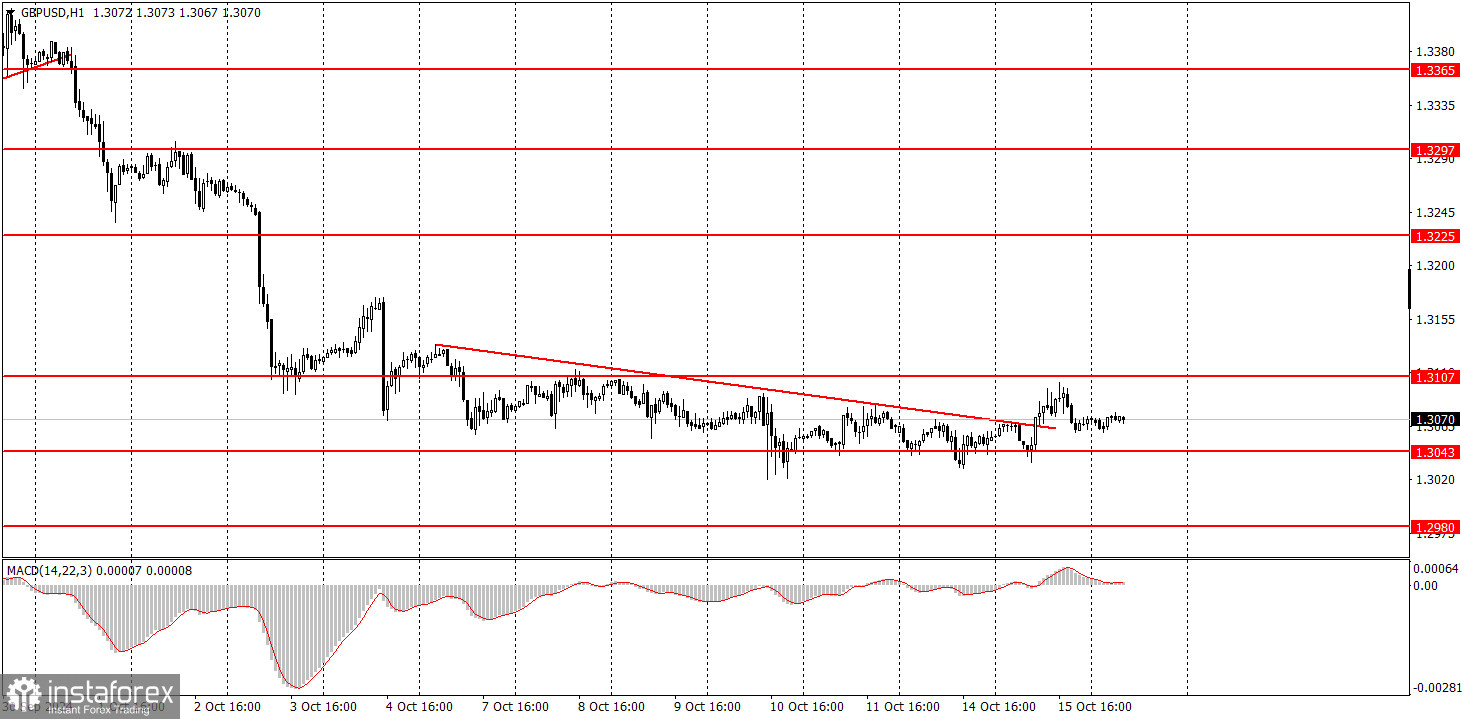
On Tuesday, the GBP/USD pair consolidated above the descending trendline, but overall, the movement over the past two weeks can be described as flat. As shown in the illustration above, the price has been trading between 1.3043 and 1.3107. Therefore, the price consolidation above the trendline within the flat is not a significant buy signal. Much more will depend on today's inflation report from the UK. It seems the market is waiting for this report because there's not much else to anticipate this week. If inflation slows down more than expected, further depreciation of the British pound can be expected, bringing the Bank of England closer to a second key rate cut. An upward correction is due but requires at least a consolidation above the 1.3107 level. And today, as we've pointed out, the pair may well resume its decline.
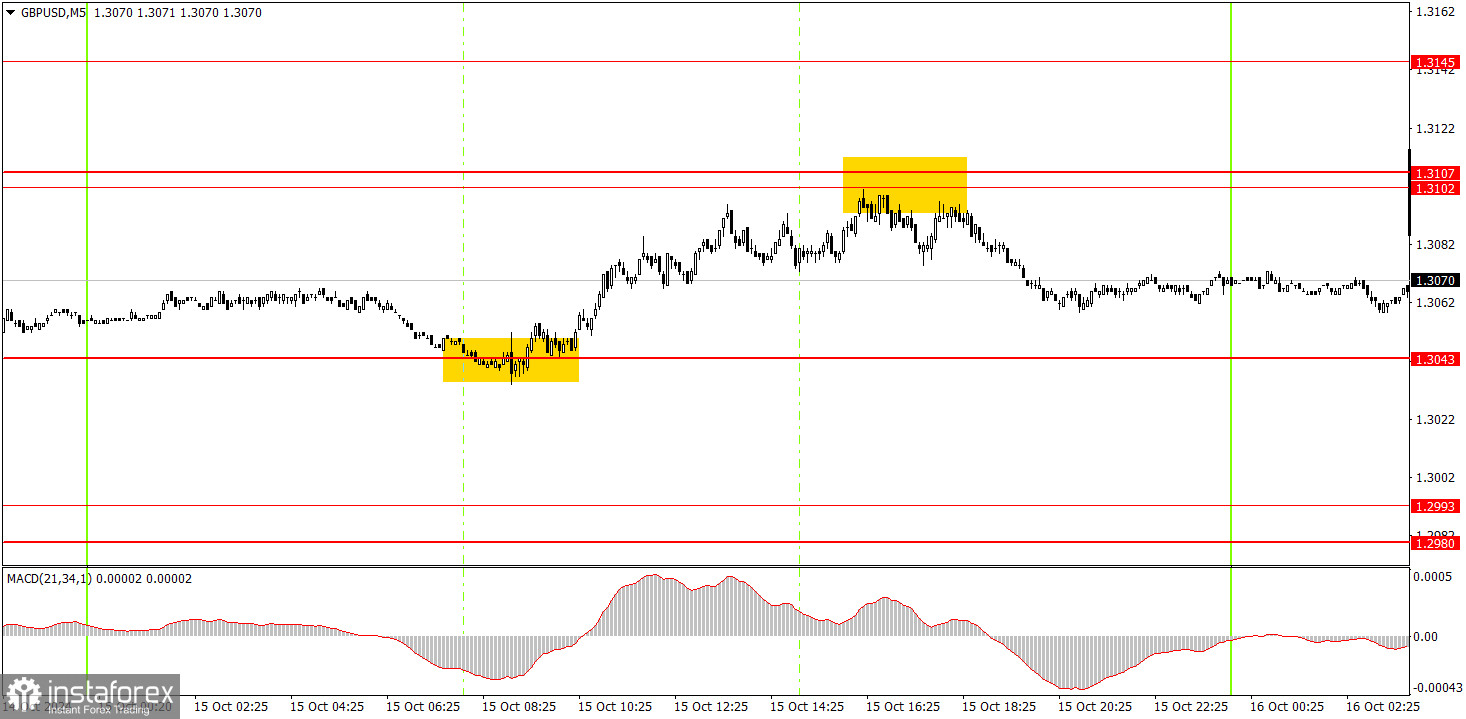
The pair formed two very good signals in the 5-minute time frame (TF) on Tuesday. First, the price bounced off the 1.3043 level (the lower boundary of the flat) and then from the 1.3102-1.3107 area (the upper boundary of the flat). Thus, novice traders could have bought and sold the pound. In both trades, even in low volatility conditions, it was possible to earn around 50 pips.
On the hourly TF, the GBP/USD pair broke the upward trend and continues to fall. The US dollar has begun its long-awaited growth, but be cautious with sales, as the pair has yet to attempt a correction in the last three weeks. For now, there are no minimal signs that the price is undergoing a correction. We fully support the pair's decline in the medium term, as we believe this is the only logical scenario.
On Wednesday, we don't expect anything other than flat movement again. A reminder for novice traders: breaking trendlines or levels in a flat is a very weak signal. Additionally, volatility is currently very low.
On the 5-minute TF, you can trade using the levels of 1.2913, 1.2980-1.2993, 1.3043, 1.3102-1.3107, 1.3145-1.3167, 1.3225, 1.3272, 1.3365, 1.3428-1.3440, 1.3488, 1.3537. On Wednesday, one of the week's key reports – inflation in the UK – will be released. This report could trigger a strong market reaction, but the direction of the movement will depend on the nature of the report, which cannot be predicted in advance.
Support and Resistance Price Levels: These levels serve as targets when opening buy or sell positions. They can also be used as points to set Take Profit levels.
Red Lines: These represent channels or trend lines that display the current trend and indicate the preferred trading direction.
MACD Indicator (14,22,3): The histogram and signal line serve as an auxiliary indicator that can also be used as a source of trading signals.
Important Speeches and Reports (always found in the news calendar) can significantly impact the movement of a currency pair. Therefore, trading should be done with maximum caution during their release, or you may choose to exit the market to avoid a sharp price reversal against the preceding movement.
For Beginners Trading on the Forex Market: It's essential to remember that not every trade will be profitable. Developing a clear strategy and practicing money management is key to achieving long-term success in trading.
InstaForex analytical reviews will make you fully aware of market trends! Being an InstaForex client, you are provided with a large number of free services for efficient trading.

