Ezeket az információkat marketingkommunikációnk részeként küldjük el lakossági és professzionális ügyfeleink számára. Nem tartalmaznak és nem tekintendők befektetési tanácsnak vagy javaslatnak, sem bármilyen pénzügyi instrumentummal való tranzakcióra vagy kereskedési stratégia használatára irányuló ajánlatnak vagy felkérésnek. A korábbi teljesítmény nem garantálja vagy jósolja meg a jövőbenit. Az Instant Trading EU Ltd. nem képviseli vagy garantálja a szolgáltatott információk pontosságát vagy teljességét, illetve nem felelős bármely, az elemzéseken, előrejelzéseken vagy a Vállalat munkatársa által adott információkon alapuló befektetések esetleges veszteségéért. A teljes felelősségkizárás itt található.
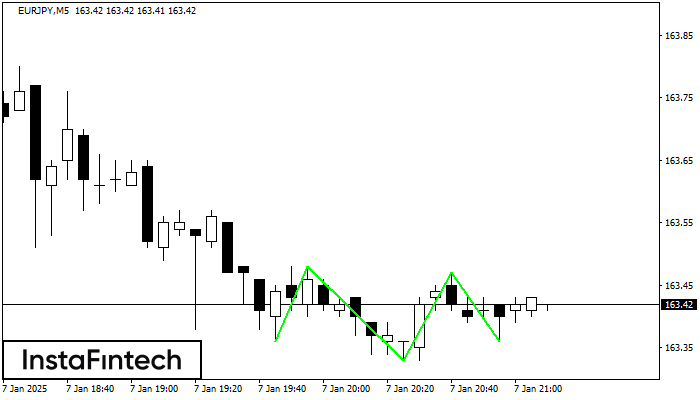
Triple Bottom
was formed on 07.01 at 21:10:48 (UTC+0)
signal strength 1 of 5
was formed on 07.01 at 21:10:48 (UTC+0)
signal strength 1 of 5

The Triple Bottom pattern has formed on the chart of EURJPY M5. Features of the pattern: The lower line of the pattern has coordinates 163.48 with the upper limit 163.48/163.47, the projection of the width is 12 points. The formation of the Triple Bottom pattern most likely indicates a change in the trend from downward to upward. This means that in the event of a breakdown of the resistance level 163.36, the price is most likely to continue the upward movement.
The M5 and M15 time frames may have more false entry points.
Figure
Instrument
Timeframe
Trend
Signal Strength

 Maradok


