
 Maradok

A grafikus minták az árak alakulását képezik le az adott chart-okban. A technikai elemzés egyik alaptétele az, hogy a történelem (vagyis az árváltozás) megismétli önmagát. Vagyis, ha a jelenlegi szituáció emlékeztet egy korábbira, akkor az árváltozás is nagy valószínűséggel hasonló lesz, így nagy valószínűséggel megjósolható.
Az InstaForex által szolgáltatott mintákkal Ön képben lehet a legújabb piaci változásokkal és időben reagálhat rájuk. Nálunk mindig a legújabb mintákat találhatja meg bármely devizapárra, bármilyen időszakban.
was formed on 24.03 at 20:46:19 (UTC+0)
signal strength 2 of 5
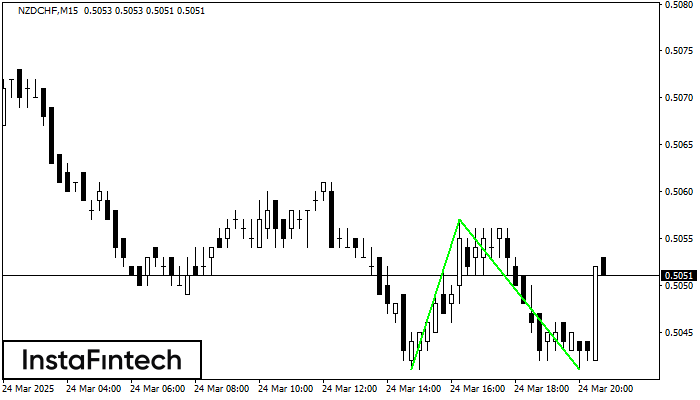
The Double Bottom pattern has been formed on NZDCHF M15. This formation signals a reversal of the trend from downwards to upwards. The signal is that a buy trade should be opened after the upper boundary of the pattern 0.5057 is broken. The further movements will rely on the width of the current pattern 16 points.
The M5 and M15 time frames may have more false entry points.
- All
- Double Top
- Flag
- Head and Shoulders
- Pennant
- Rectangle
- Triangle
- Triple top
- All
- #AAPL
- #AMZN
- #EBAY
- #FB
- #GOOG
- #INTC
- #KO
- #MA
- #MCD
- #MSFT
- #NTDOY
- #PEP
- #TSLA
- #TWTR
- AUDCAD
- AUDCHF
- AUDJPY
- AUDUSD
- EURCAD
- EURCHF
- EURGBP
- EURJPY
- EURNZD
- EURRUB
- EURUSD
- GBPAUD
- GBPCHF
- GBPJPY
- GBPUSD
- GOLD
- NZDCAD
- NZDCHF
- NZDJPY
- NZDUSD
- SILVER
- USDCAD
- USDCHF
- USDJPY
- USDRUB
- All
- M5
- M15
- M30
- H1
- D1
- All
- Buy
- Sale
- All
- 1
- 2
- 3
- 4
- 5

Secondo il grafico di M5, GBPAUD ha formato il modello Triangolo Simmetrico Rialzista. Il confine inferiore del modello tocca le coordinate 2.0704/2.0775 mentre il confine superiore attraversa 2.0831/2.0775
I time frame M5 e M15 possono avere più punti di ingresso falsi.
Open chart in a new window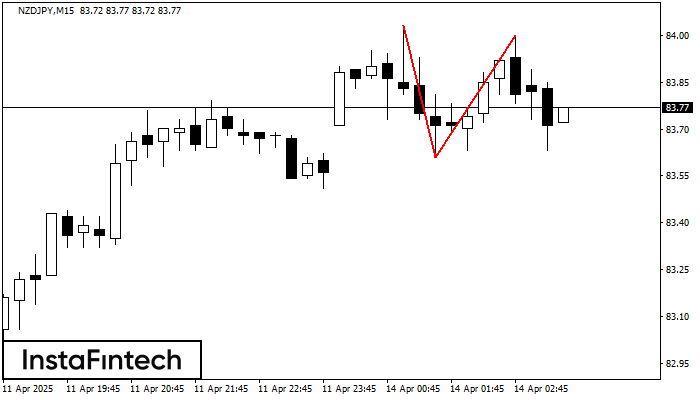
Il modello di inversione Doppio Massimo è stato formato su NZDJPY M15. Caratteristiche: il confine superiore 84.03; il confine inferiore 83.61; la larghezza del modello è di 39 punti
I time frame M5 e M15 possono avere più punti di ingresso falsi.
Open chart in a new window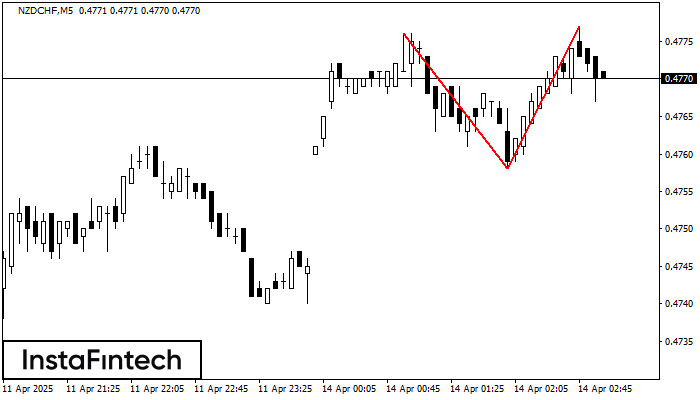
Il modello di inversione Doppio Massimo è stato formato su NZDCHF M5. Caratteristiche: il confine superiore 0.4776; il confine inferiore 0.4758; la larghezza del modello è di 19 punti
I time frame M5 e M15 possono avere più punti di ingresso falsi.
Open chart in a new window


