
 Maradok


A grafikus minták az árak alakulását képezik le az adott chart-okban. A technikai elemzés egyik alaptétele az, hogy a történelem (vagyis az árváltozás) megismétli önmagát. Vagyis, ha a jelenlegi szituáció emlékeztet egy korábbira, akkor az árváltozás is nagy valószínűséggel hasonló lesz, így nagy valószínűséggel megjósolható.
Az InstaForex által szolgáltatott mintákkal Ön képben lehet a legújabb piaci változásokkal és időben reagálhat rájuk. Nálunk mindig a legújabb mintákat találhatja meg bármely devizapárra, bármilyen időszakban.
was formed on 27.03 at 10:10:13 (UTC+0)
signal strength 1 of 5

According to the chart of M5, GBPCHF formed the Head and Shoulders pattern. The Head’s top is set at 1.1418 while the median line of the Neck is found at 1.1408/1.1408. The formation of the Head and Shoulders pattern evidently signals a reversal of the upward trend. In other words, in case the scenario comes true, the price of GBPCHF will go towards 1.1393.
The M5 and M15 time frames may have more false entry points.
- All
- Double Top
- Flag
- Head and Shoulders
- Pennant
- Rectangle
- Triangle
- Triple top
- All
- #AAPL
- #AMZN
- #EBAY
- #FB
- #GOOG
- #INTC
- #KO
- #MA
- #MCD
- #MSFT
- #NTDOY
- #PEP
- #TSLA
- #TWTR
- AUDCAD
- AUDCHF
- AUDJPY
- AUDUSD
- EURCAD
- EURCHF
- EURGBP
- EURJPY
- EURNZD
- EURRUB
- EURUSD
- GBPAUD
- GBPCHF
- GBPJPY
- GBPUSD
- GOLD
- NZDCAD
- NZDCHF
- NZDJPY
- NZDUSD
- SILVER
- USDCAD
- USDCHF
- USDJPY
- USDRUB
- All
- M5
- M15
- M30
- H1
- D1
- All
- Buy
- Sale
- All
- 1
- 2
- 3
- 4
- 5
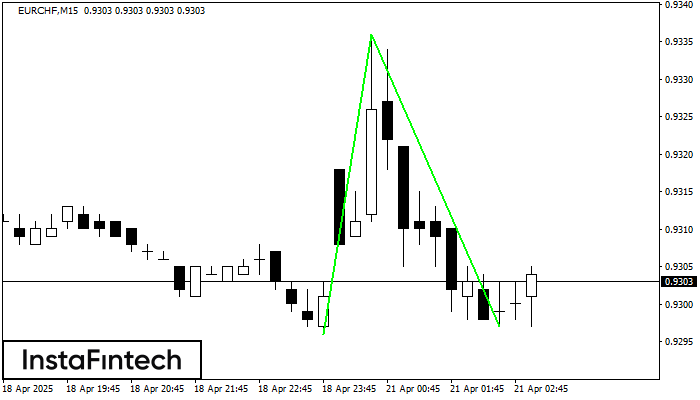
The Double Bottom pattern has been formed on EURCHF M15. Characteristics: the support level 0.9296; the resistance level 0.9336; the width of the pattern 40 points. If the resistance level
The M5 and M15 time frames may have more false entry points.
Open chart in a new window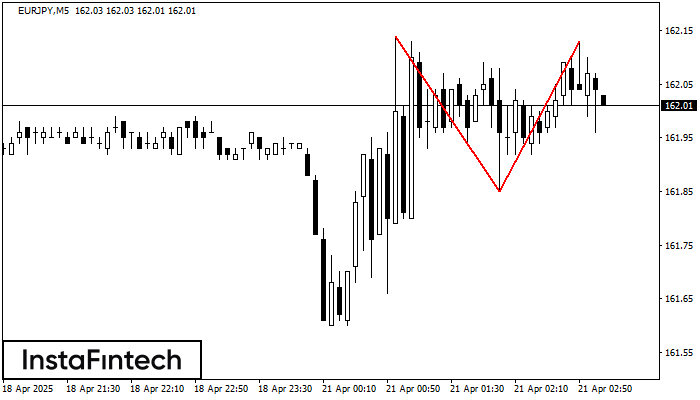
The Double Top pattern has been formed on EURJPY M5. It signals that the trend has been changed from upwards to downwards. Probably, if the base of the pattern 161.85
The M5 and M15 time frames may have more false entry points.
Open chart in a new window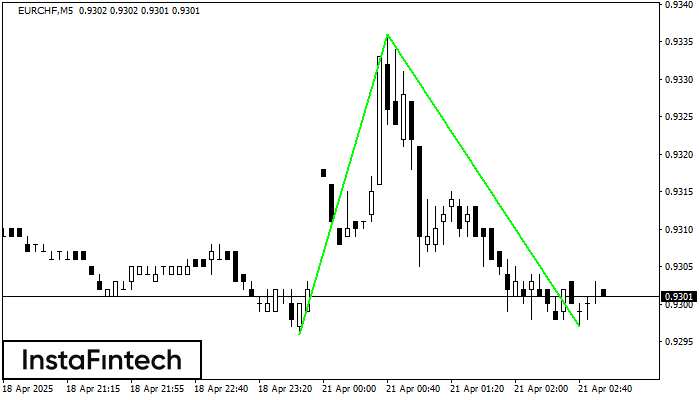
The Double Bottom pattern has been formed on EURCHF M5. Characteristics: the support level 0.9296; the resistance level 0.9336; the width of the pattern 40 points. If the resistance level
The M5 and M15 time frames may have more false entry points.
Open chart in a new window


