
 Maradok

A grafikus minták az árak alakulását képezik le az adott chart-okban. A technikai elemzés egyik alaptétele az, hogy a történelem (vagyis az árváltozás) megismétli önmagát. Vagyis, ha a jelenlegi szituáció emlékeztet egy korábbira, akkor az árváltozás is nagy valószínűséggel hasonló lesz, így nagy valószínűséggel megjósolható.
Az InstaForex által szolgáltatott mintákkal Ön képben lehet a legújabb piaci változásokkal és időben reagálhat rájuk. Nálunk mindig a legújabb mintákat találhatja meg bármely devizapárra, bármilyen időszakban.
was formed on 27.03 at 17:40:23 (UTC+0)
signal strength 1 of 5
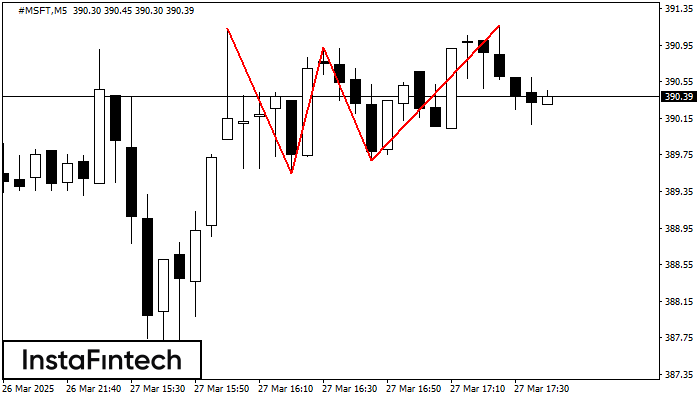
The Triple Top pattern has formed on the chart of the #MSFT M5 trading instrument. It is a reversal pattern featuring the following characteristics: resistance level -3, support level -14, and pattern’s width 158. Forecast If the price breaks through the support level 389.55, it is likely to move further down to 390.77.
The M5 and M15 time frames may have more false entry points.
- All
- Double Top
- Flag
- Head and Shoulders
- Pennant
- Rectangle
- Triangle
- Triple top
- All
- #AAPL
- #AMZN
- #EBAY
- #FB
- #GOOG
- #INTC
- #KO
- #MA
- #MCD
- #MSFT
- #NTDOY
- #PEP
- #TSLA
- #TWTR
- AUDCAD
- AUDCHF
- AUDJPY
- AUDUSD
- EURCAD
- EURCHF
- EURGBP
- EURJPY
- EURNZD
- EURRUB
- EURUSD
- GBPAUD
- GBPCHF
- GBPJPY
- GBPUSD
- GOLD
- NZDCAD
- NZDCHF
- NZDJPY
- NZDUSD
- SILVER
- USDCAD
- USDCHF
- USDJPY
- USDRUB
- All
- M5
- M15
- M30
- H1
- D1
- All
- Buy
- Sale
- All
- 1
- 2
- 3
- 4
- 5
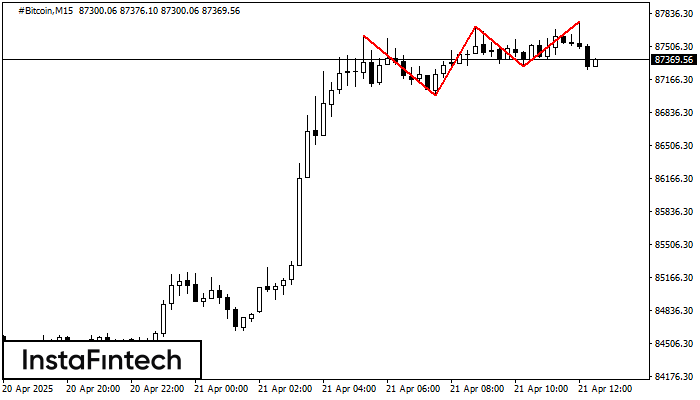
Sul grafico dello strumento di trading #Bitcoin M15, si è formato il modello Triplo Massimo che segnala un cambiamento di trend. È possibile che dopo la formazione del terzo picco
I time frame M5 e M15 possono avere più punti di ingresso falsi.
Open chart in a new window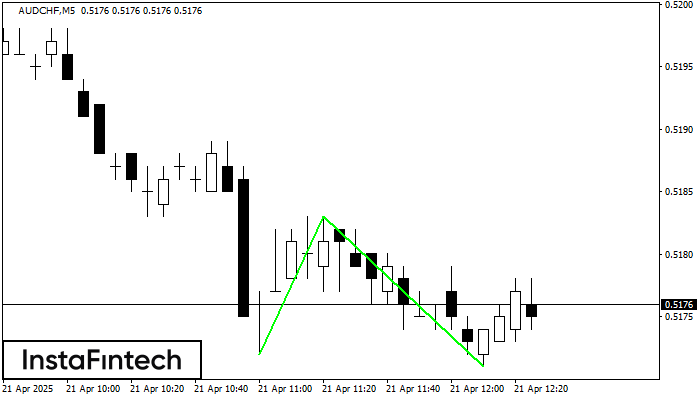
Il modello Doppio Minimo è stato formato su AUDCHF M5. Questa formazione segnala un'inversione del trend dal discendente all'ascendente. Il segnale è che una posizione buy dovrebbe essere aperta dopo
I time frame M5 e M15 possono avere più punti di ingresso falsi.
Open chart in a new window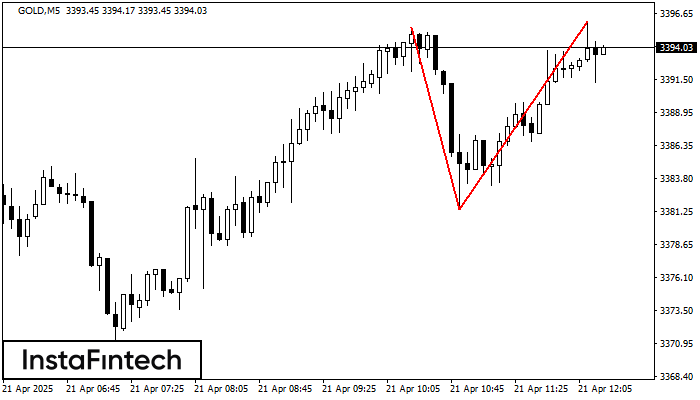
Il modello di inversione Doppio Massimo è stato formato su GOLD M5. Caratteristiche: il confine superiore 3395.58; il confine inferiore 3381.38; la larghezza del modello è di 1463 punti
I time frame M5 e M15 possono avere più punti di ingresso falsi.
Open chart in a new window


