
 Maradok


A grafikus minták az árak alakulását képezik le az adott chart-okban. A technikai elemzés egyik alaptétele az, hogy a történelem (vagyis az árváltozás) megismétli önmagát. Vagyis, ha a jelenlegi szituáció emlékeztet egy korábbira, akkor az árváltozás is nagy valószínűséggel hasonló lesz, így nagy valószínűséggel megjósolható.
Az InstaForex által szolgáltatott mintákkal Ön képben lehet a legújabb piaci változásokkal és időben reagálhat rájuk. Nálunk mindig a legújabb mintákat találhatja meg bármely devizapárra, bármilyen időszakban.
was formed on 28.03 at 18:06:41 (UTC+0)
signal strength 1 of 5
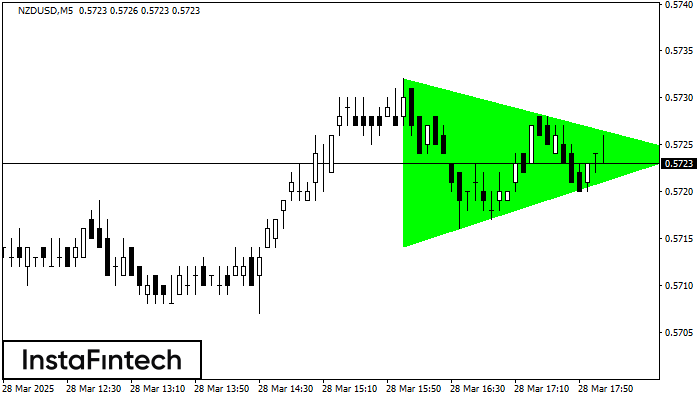
According to the chart of M5, NZDUSD formed the Bullish Symmetrical Triangle pattern, which signals the trend will continue. Description. The upper border of the pattern touches the coordinates 0.5732/0.5724 whereas the lower border goes across 0.5714/0.5724. The pattern width is measured on the chart at 18 pips. If the Bullish Symmetrical Triangle pattern is in progress during the upward trend, this indicates the current trend will go on. In case 0.5724 is broken, the price could continue its move toward 0.5739.
The M5 and M15 time frames may have more false entry points.
See Also
- All
- Double Top
- Flag
- Head and Shoulders
- Pennant
- Rectangle
- Triangle
- Triple top
- All
- #AAPL
- #AMZN
- #EBAY
- #FB
- #GOOG
- #INTC
- #KO
- #MA
- #MCD
- #MSFT
- #NTDOY
- #PEP
- #TSLA
- #TWTR
- AUDCAD
- AUDCHF
- AUDJPY
- AUDUSD
- EURCAD
- EURCHF
- EURGBP
- EURJPY
- EURNZD
- EURRUB
- EURUSD
- GBPAUD
- GBPCHF
- GBPJPY
- GBPUSD
- GOLD
- NZDCAD
- NZDCHF
- NZDJPY
- NZDUSD
- SILVER
- USDCAD
- USDCHF
- USDJPY
- USDRUB
- All
- M5
- M15
- M30
- H1
- D1
- All
- Buy
- Sale
- All
- 1
- 2
- 3
- 4
- 5
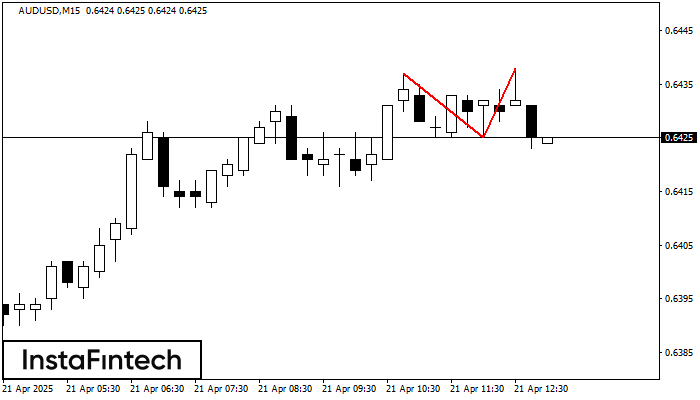
O padrão de reversão Topo duplo foi formado em AUDUSD M15. Características: o limite superior 0.6437; o limite inferior 0.6425; a largura do padrão é de 13 pontos. As operações
Os intervalos M5 e M15 podem ter mais pontos de entrada falsos.
Open chart in a new window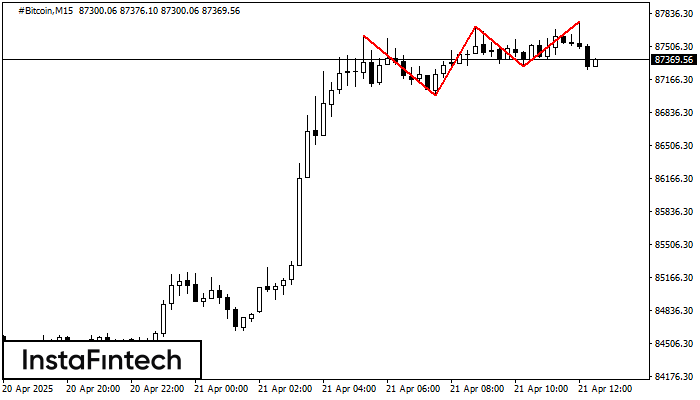
No gráfico do instrumento de negociação #Bitcoin M15, o padrão Topo triplo que sinaliza uma mudança de tendência se formou. É possível que após a formação do terceiro pico
Os intervalos M5 e M15 podem ter mais pontos de entrada falsos.
Open chart in a new window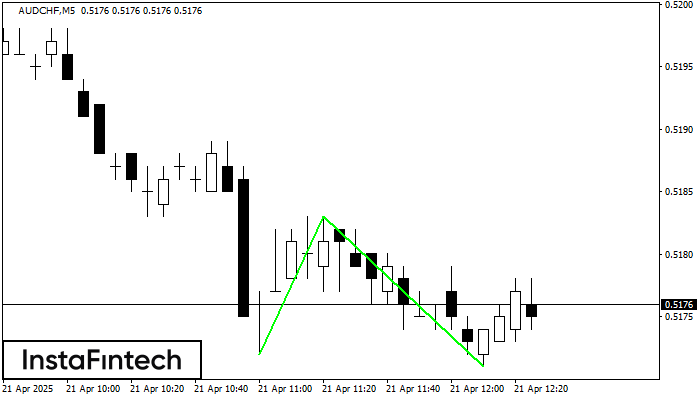
O padrão Fundo duplo foi formado em AUDCHF M5. Esta formação sinaliza uma reversão da tendência de baixo para cima. O sinal é que uma negociação de compra deve
Os intervalos M5 e M15 podem ter mais pontos de entrada falsos.
Open chart in a new window


