
 Maradok

A grafikus minták az árak alakulását képezik le az adott chart-okban. A technikai elemzés egyik alaptétele az, hogy a történelem (vagyis az árváltozás) megismétli önmagát. Vagyis, ha a jelenlegi szituáció emlékeztet egy korábbira, akkor az árváltozás is nagy valószínűséggel hasonló lesz, így nagy valószínűséggel megjósolható.
Az InstaForex által szolgáltatott mintákkal Ön képben lehet a legújabb piaci változásokkal és időben reagálhat rájuk. Nálunk mindig a legújabb mintákat találhatja meg bármely devizapárra, bármilyen időszakban.
was formed on 01.04 at 07:09:57 (UTC+0)
signal strength 1 of 5
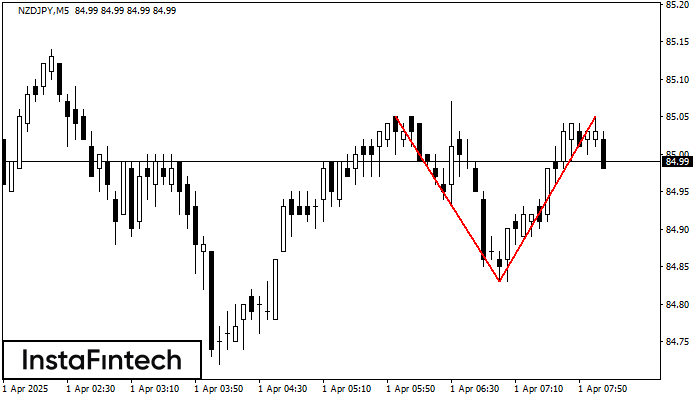
The Double Top reversal pattern has been formed on NZDJPY M5. Characteristics: the upper boundary 85.05; the lower boundary 84.83; the width of the pattern is 22 points. Sell trades are better to be opened below the lower boundary 84.83 with a possible movements towards the 84.68 level.
The M5 and M15 time frames may have more false entry points.
See Also
- All
- Double Top
- Flag
- Head and Shoulders
- Pennant
- Rectangle
- Triangle
- Triple top
- All
- #AAPL
- #AMZN
- #EBAY
- #FB
- #GOOG
- #INTC
- #KO
- #MA
- #MCD
- #MSFT
- #NTDOY
- #PEP
- #TSLA
- #TWTR
- AUDCAD
- AUDCHF
- AUDJPY
- AUDUSD
- EURCAD
- EURCHF
- EURGBP
- EURJPY
- EURNZD
- EURRUB
- EURUSD
- GBPAUD
- GBPCHF
- GBPJPY
- GBPUSD
- GOLD
- NZDCAD
- NZDCHF
- NZDJPY
- NZDUSD
- SILVER
- USDCAD
- USDCHF
- USDJPY
- USDRUB
- All
- M5
- M15
- M30
- H1
- D1
- All
- Buy
- Sale
- All
- 1
- 2
- 3
- 4
- 5
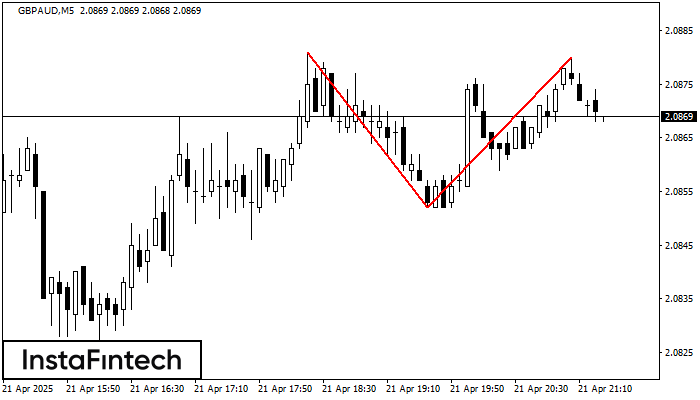
On the chart of GBPAUD M5 the Double Top reversal pattern has been formed. Characteristics: the upper boundary 2.0880; the lower boundary 2.0852; the width of the pattern 28 points
The M5 and M15 time frames may have more false entry points.
Open chart in a new window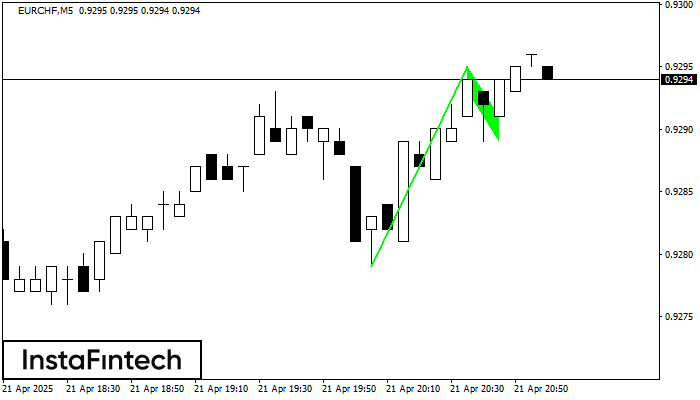
The Bullish Flag pattern has been formed on the chart EURCHF M5 which signals that the upward trend will continue. Signals: а break of the peak at 0.9295 may push
The M5 and M15 time frames may have more false entry points.
Open chart in a new window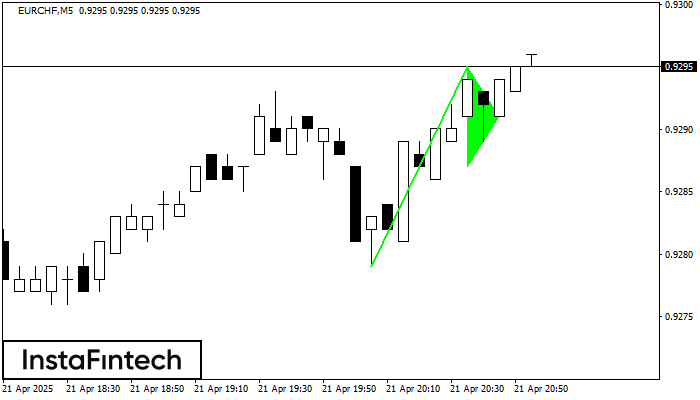
The Bullish pennant pattern is formed on the EURCHF M5 chart. It is a type of the continuation pattern. Supposedly, in case the price is fixed above the pennant’s high
The M5 and M15 time frames may have more false entry points.
Open chart in a new window


