
 Maradok

A grafikus minták az árak alakulását képezik le az adott chart-okban. A technikai elemzés egyik alaptétele az, hogy a történelem (vagyis az árváltozás) megismétli önmagát. Vagyis, ha a jelenlegi szituáció emlékeztet egy korábbira, akkor az árváltozás is nagy valószínűséggel hasonló lesz, így nagy valószínűséggel megjósolható.
Az InstaForex által szolgáltatott mintákkal Ön képben lehet a legújabb piaci változásokkal és időben reagálhat rájuk. Nálunk mindig a legújabb mintákat találhatja meg bármely devizapárra, bármilyen időszakban.
was formed on 02.04 at 21:51:40 (UTC+0)
signal strength 1 of 5

According to the chart of M5, GBPAUD formed the Bullish Symmetrical Triangle pattern, which signals the trend will continue. Description. The upper border of the pattern touches the coordinates 2.0619/2.0611 whereas the lower border goes across 2.0603/2.0611. The pattern width is measured on the chart at 16 pips. If the Bullish Symmetrical Triangle pattern is in progress during the upward trend, this indicates the current trend will go on. In case 2.0611 is broken, the price could continue its move toward 2.0626.
The M5 and M15 time frames may have more false entry points.
See Also
- All
- Double Top
- Flag
- Head and Shoulders
- Pennant
- Rectangle
- Triangle
- Triple top
- All
- #AAPL
- #AMZN
- #EBAY
- #FB
- #GOOG
- #INTC
- #KO
- #MA
- #MCD
- #MSFT
- #NTDOY
- #PEP
- #TSLA
- #TWTR
- AUDCAD
- AUDCHF
- AUDJPY
- AUDUSD
- EURCAD
- EURCHF
- EURGBP
- EURJPY
- EURNZD
- EURRUB
- EURUSD
- GBPAUD
- GBPCHF
- GBPJPY
- GBPUSD
- GOLD
- NZDCAD
- NZDCHF
- NZDJPY
- NZDUSD
- SILVER
- USDCAD
- USDCHF
- USDJPY
- USDRUB
- All
- M5
- M15
- M30
- H1
- D1
- All
- Buy
- Sale
- All
- 1
- 2
- 3
- 4
- 5
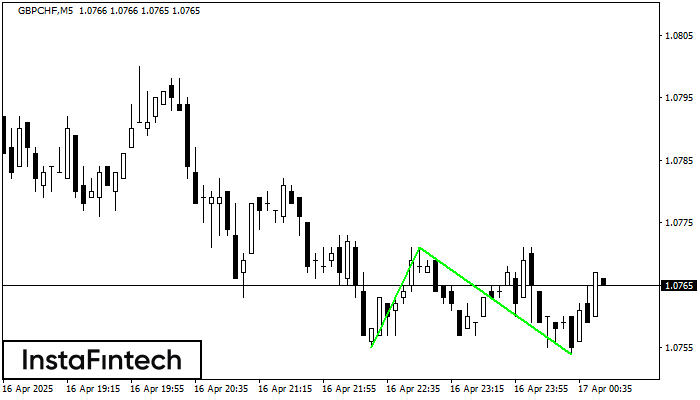
The Double Bottom pattern has been formed on GBPCHF M5. This formation signals a reversal of the trend from downwards to upwards. The signal is that a buy trade should
The M5 and M15 time frames may have more false entry points.
Open chart in a new window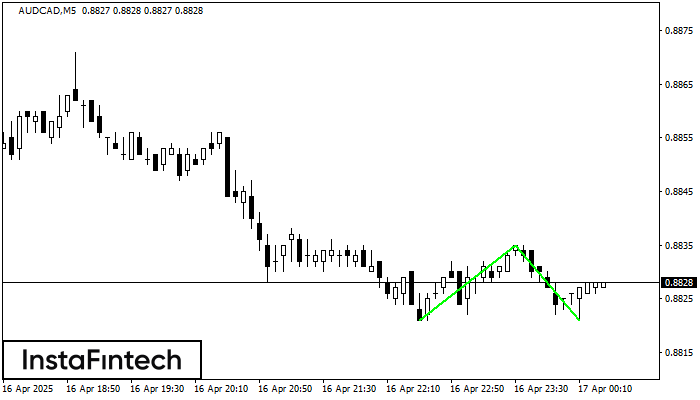
The Double Bottom pattern has been formed on AUDCAD M5; the upper boundary is 0.8835; the lower boundary is 0.8821. The width of the pattern is 14 points. In case
The M5 and M15 time frames may have more false entry points.
Open chart in a new window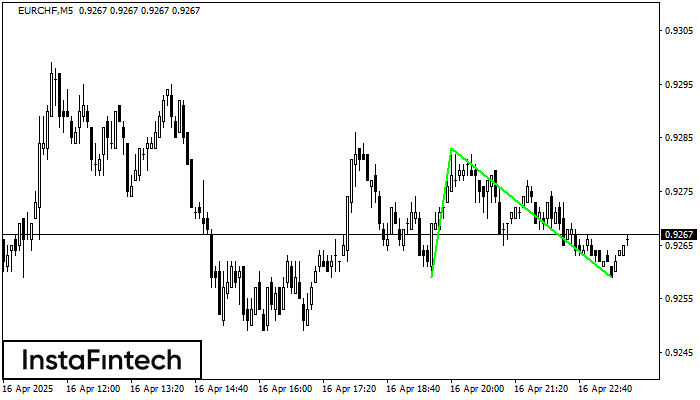
The Double Bottom pattern has been formed on EURCHF M5; the upper boundary is 0.9283; the lower boundary is 0.9259. The width of the pattern is 24 points. In case
The M5 and M15 time frames may have more false entry points.
Open chart in a new window


