 Rimani
Condizioni di trading
Strumenti


EUR/USD has bounced as expected from 1.1230 area towards 1.13 as we expected in our previous analysis. Here at 1.13 we have short-term confluence of resistance. Previous lows that was once support is here. 38% Fibonacci retracement is here. And our own proprietary indicator resistance is here as well.
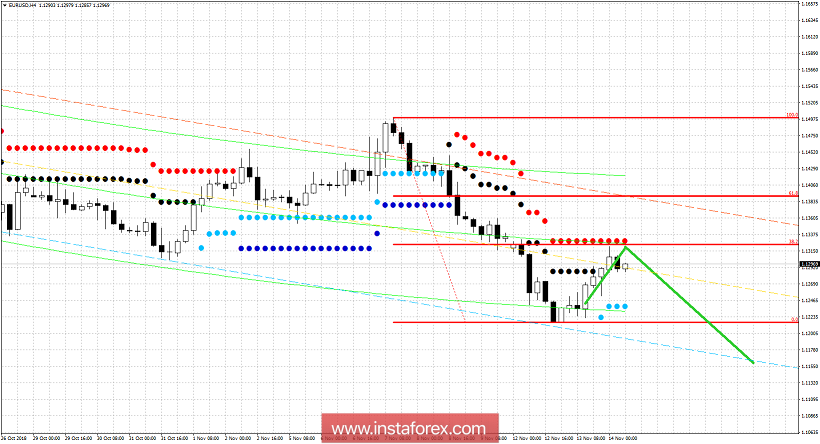
Blue dots - short-term medium strength support
Green lines - expected path
On a daily basis resistance is at 1.1375 while at 1.1390 we have the 61.8% Fibonacci retracement resistance. If EUR/USD manages to break and hold above the red dots in the 4 hour chart, we could then see a move towards the 1.1375-1.1390 area. A rejection at current level of resistance at 1.13 could lead to new lows. Support is at 1.1240-1.1220. Breaking below this level will push price below 1.12 towards 1.1150.
Le recensioni analitiche di InstaForex ti renderanno pienamente consapevole delle tendenze del mercato! Essendo un cliente InstaForex, ti viene fornito un gran numero di servizi gratuiti per il trading efficiente.

