 Rimani
Condizioni di trading
Strumenti


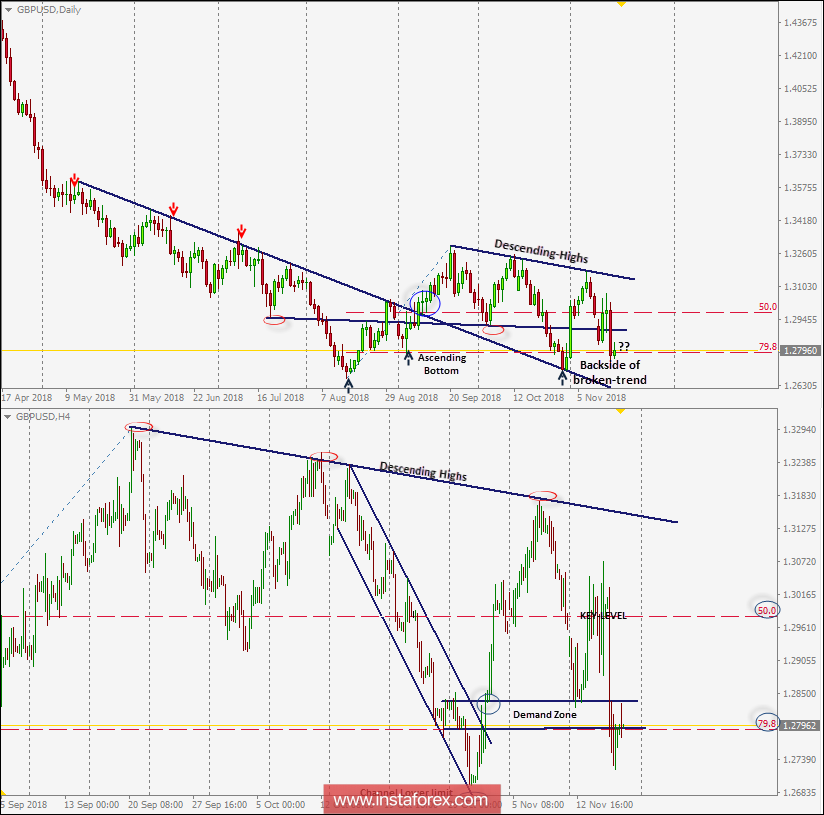
On September 21, the GBP/USD failed to demonstrate sufficient bullish momentum above 1.3296. The short-term outlook turned to become bearish to test the backside of the broken uptrend.
On H4 chart, the GBP/USD pair looked oversold around the price levels of 1.2700 where profitable BUY entries were suggested.
A Quick bullish movement was demonstrated towards the price level of 1.3170-1.3200 where the depicted downtrend came to meet the GBP/USD pair.
Last week, signs of bearish rejection were demonstrated around the price zone of 1.3170-1.3200 (the depicted downtrend).
This initiated the current bearish pullback towards the depicted demand-zone of (1.2850-1.2780) where early signs of bullish rejection were recently demonstrated.
Earlier this week, the GBP/USD pair failed to establish a successful bullish breakout above the price level of 1.2980 (key-level for the short-term scenario). That's why, a quick bearish decline was demonstrated towards the price level of 1.2780.
Bullish persistence above the price zone of 1.2850-1.2780 (demand-zone) is needed to prevent further bearish decline and to allow another bullish movement to occur towards 1.2980.
On the other hand, bearish persistence below 1.2780 allows a further decline towards 1.2700 and 1.2670.
Le recensioni analitiche di InstaForex ti renderanno pienamente consapevole delle tendenze del mercato! Essendo un cliente InstaForex, ti viene fornito un gran numero di servizi gratuiti per il trading efficiente.


