 Rimani
Condizioni di trading
Strumenti


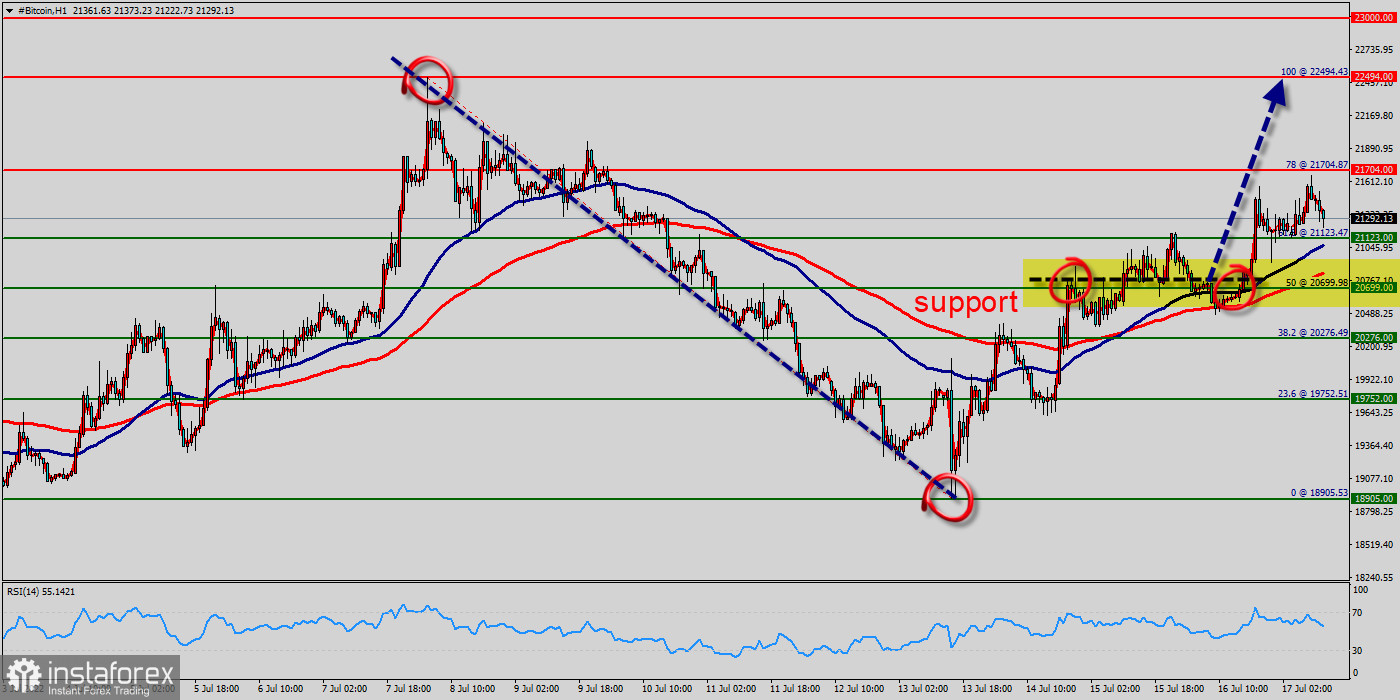
The bullish trend is currently very strong for BITCOIN - BTC/USD. As long as the price remains above the support at 20,000 USD, you could try to take advantage of the bullish rally in short term.
The first bullish objective is located at 21,704 USD (this price is coincided with the ratio 78% of Fibonacci retracement levels). The bullish momentum would be revived by a break in this resistance.
Closing above the pivot point (20,699 USD) could assure that BTC/USD will move higher towards cooling new highs. The bulls must break through 21,000 USD in order to resume the up trend.
Buyers would then use the next resistance located at 22,494 USD as an objective (this price is coincided with the ratio 100% of Fibonacci retracement levels - the double top - te last bullish wave on the hourly chart).
Crossing it would then enable buyers to target 22,494 USD. Be careful, given the powerful bullish rally underway, excesses could lead to a short-term rebound.
Bitcoin's price has been consolidating between the 20,000 USD and 22,494 USD over the last few weeks, following a massive rising from the 17,600 USD mark. So far, the price has been supported by the 17,600 USD - 20,000 USD range.
If this is the case, remember that trading against the trend may be riskier. It would seem more appropriate to wait for a signal indicating reversal of the trend.
However, considering the current price action and the third rejection from this area, a run to the 20,699 USD support level and the 50-day moving average seems more likely. A bullish breakout from these levels would initiate a rally towards the 21,704 USD - 22,494 USD supply zone – a key level to which the price's reaction would determine the mid-term trend of the market.
In the very short term, the general bearish sentiment is confirmed by technical indicators. Nevertheless, a small upwards rebound in the very short term could occur in case of excessive bearish movements.
After finding bids reach to 18,905 USD, bitcoin price recovered above 18,905 USD, 19,000 USD and 20,000 USD. Initial Bitcoin resistance lies near the 21,123 USD level (61.8% of Fibonacci retracement levels).
A decent breakout and follow-up move above21,123 USD could open the gate for a push towards the 21,704 USD level. The main resistance remains near the area of 21,704 USD - 22,494 USD.
Also it should be noted that Bitcoin and cryptocurrencies unite as the bears lose their momentum. The market is indicating a bullish opportunity above the above-mentioned support levels, for that the bullish outlook remains the same as long as the 100 EMA is headed to the upside.
Trading BTC/USD :
An uptrend will start as soon, as the market rises above resistance level 21,000 USD, which will be followed by moving up to resistance level 21,704 USD. Further close above the high end may cause a rally towards 22,494 USD. Nonetheless, the weekly resistance level and zone should be considered.
Crypto industry news (Bitcoin News) :
The BITCOIN - BTC/USD rating is 21,3000 USD (right now). On the day, this instrument lost - 2,50% and was traded between 20,000 USD and 22,494 USD over the period. The price is currently at +1% from its lowest and -3% from its highest. The Central Gaps scanner detects a bullish opening marking the presence of buyers ahead of sellers at the opening but not sufficiently marked to allow the price to register a quotation gap.
Le recensioni analitiche di InstaForex ti renderanno pienamente consapevole delle tendenze del mercato! Essendo un cliente InstaForex, ti viene fornito un gran numero di servizi gratuiti per il trading efficiente.

