 Rimani
Condizioni di trading
Strumenti

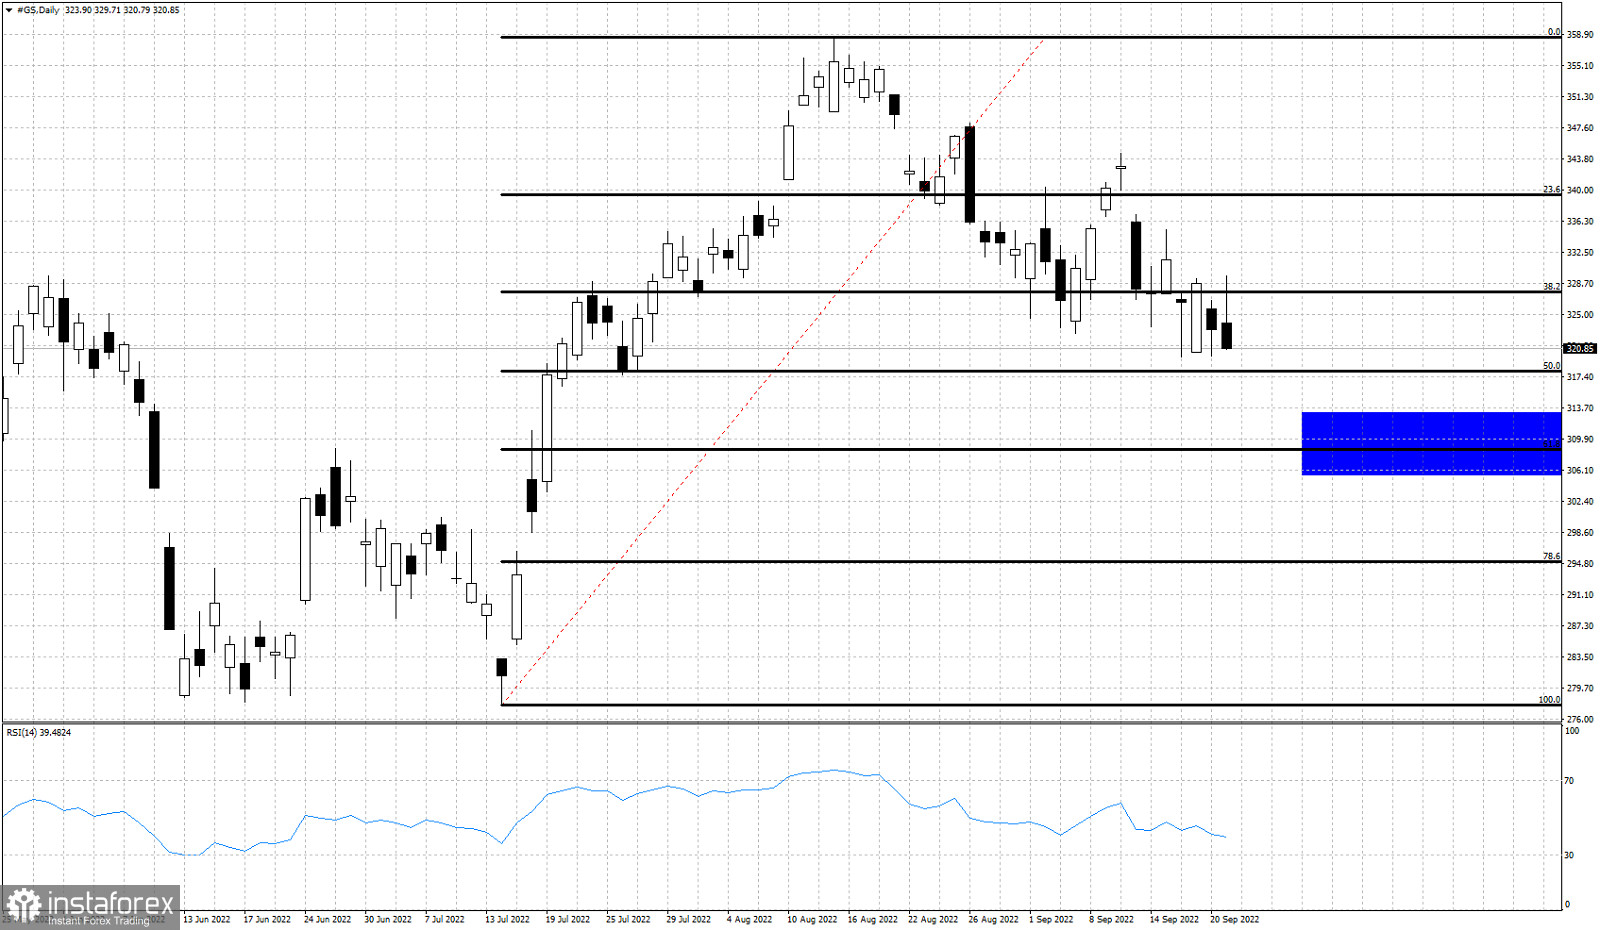
Black lines- Fibonacci retracement levels
Blue rectangle- short-term target area
Around September 14th we posted an analysis on GS stock. At that point GS stock was trading around $327 and we noted that the decline is most probably not over and that price could be heading towards $310. Price has broken below the $322 low and is moving to new short-term lower lows. At $317-18 we find the next Fibonacci retracement support, but we believe the most probable target area is shown in the Daily chart above with a blue rectangle. The 61.8% Fibonacci retracement level is our most probable target.
Le recensioni analitiche di InstaForex ti renderanno pienamente consapevole delle tendenze del mercato! Essendo un cliente InstaForex, ti viene fornito un gran numero di servizi gratuiti per il trading efficiente.


