 Rimani
Condizioni di trading
Strumenti


EUR/USD 5M
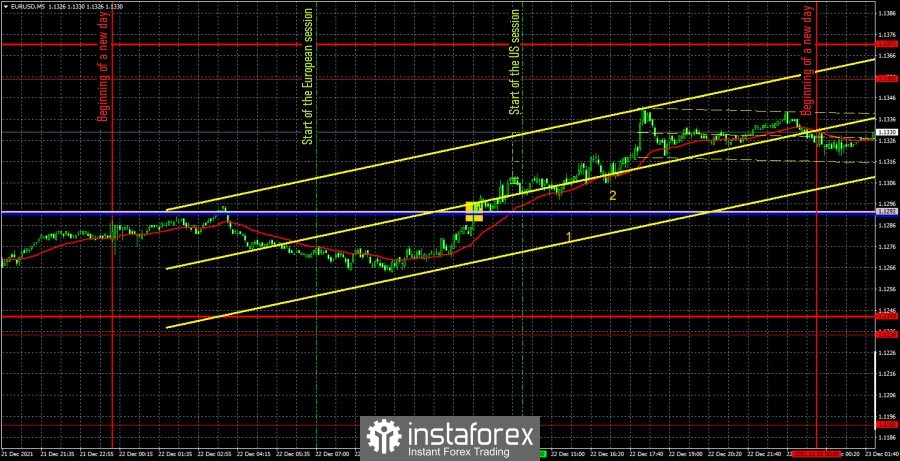
Yesterday, the EUR/USD pair continued to trade within the 1.1234-1.1355 horizontal channel, which is clearly seen in the chart, on the hourly timeframe. There was an uptrend movement on the 5-minute timeframe all day, so trading was very pleasant yesterday. In addition to the very good movement, several macroeconomic reports were also released on Wednesday. The number "1" in the chart above shows the time when the GDP report in the third estimate for the third quarter was published. The number "2" marks the time when the consumer confidence indicator was released. As you can see, neither the first nor the second report influenced the pair's movement. Both turned out to be above the forecasted values, therefore, they should have provoked a rise in the dollar, and not its fall. Thus, it remains only to analyze the only trading signal that was formed on Wednesday. It was formed when the price crossed the Senkou Span B and Kijun-sen lines. Since before this signal, the movement was also not flat, but a trend, it could be assumed that the signal would be strong. And so it happened. After its formation, the pair went up about 28 points. This is exactly the kind of profit traders could get by opening long positions. The pair did not reach the nearest target level. The volatility of the day was 78 points, which is very good for the holiday period.
EUR/USD 1H
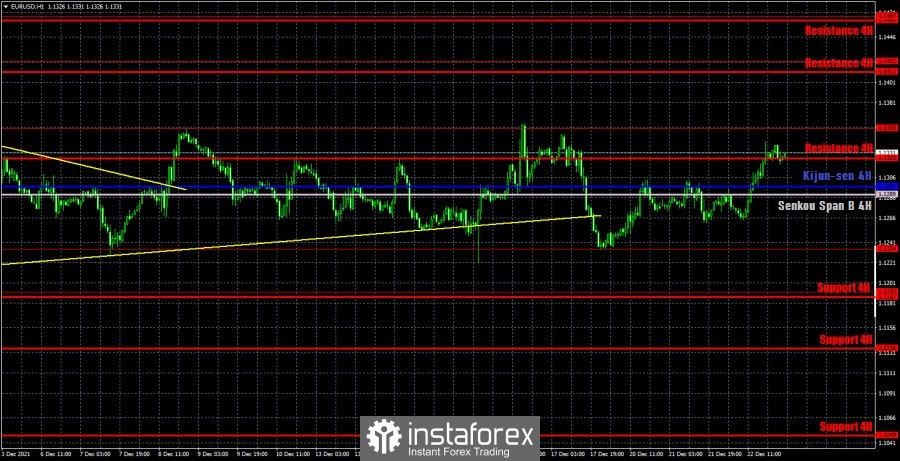
On the hourly timeframe, you can clearly see that the pair continues to trade exclusively between the levels of 1.1234 and 1.1355. Thus, the technical picture has not changed over the past day. After the quotes bounced off the lower border of the channel, they continue to move to the upper border. If a rebound follows from the upper border, a new round of the downward movement to the level of 1.1234 will begin. We highlight the following levels for trading on Thursday - 1.1192, 1.1234, 1.1355, as well as the Senkou Span B (1.1289) and Kijun-sen (1.1297) lines. The Ichimoku indicator lines can change their position during the day, which should be taken into account when looking for trading signals. Signals can be "rebounds" and "breakthroughs" of these levels and lines. Do not forget about placing a Stop Loss order at breakeven if the price moves 15 points in the right direction. This will protect you against possible losses if the signal turns out to be false. We also take into account the fact that the pair is now flat, so the lines of the Ichimoku indicator are weak. No interesting event and macroeconomic report in the European Union on December 23. Meanwhile, the US will publish a report on orders for durable goods, reports on changes in income and spending levels of the population, as well as a report on applications for unemployment benefits. All of them are of secondary importance and are unlikely to be marked by the market.
We recommend you to familiarize yourself:
Overview of the EUR/USD pair. December 23. The euro is already celebrating and only the news about the Omicron does not allow the market to fall asleep completely.
Overview of the GBP/USD pair. December 23. Boris Johnson refused to introduce a lockdown and the pound surged.
Forecast and trading signals for GBP/USD for December 23. Detailed analysis of the movement of the pair and trade deals.
Analysis of the COT report
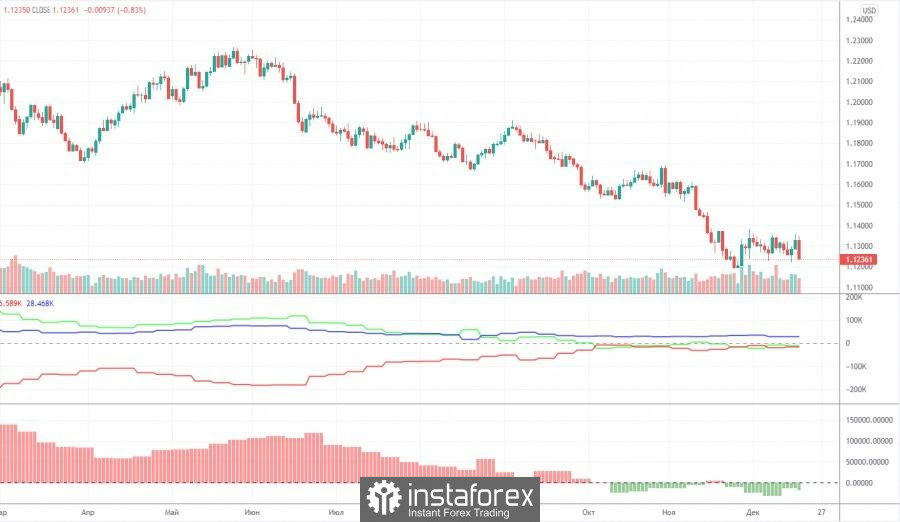
The mood of non-commercial traders has become... a little more bearish during the last reporting week (December 7-13). The "non-commercial" group of traders now has more short positions than long ones, but this advantage is minimal. The difference is only 18,000 contracts, which is not so much. During the reporting week, professional traders closed 7,200 buy contracts (longs) and 2,800 sell contracts (shorts). Thus, the net position of professional players decreased by 4,000. However, the main thing to note is that the green and red lines of the first indicator (indicating the change in the net positions of the non-commercial and commercial groups) have been near the zero level for a long time, as well as in close proximity to each other. That is, in the last few months, when the European currency continued to fall against the dollar, the major players no longer increased their shorts. Thus, the question arises, why did the euro fall at all if market participants did not sell it? Perhaps global factors, such as changes in the balance between the EU and US money supply, are interfering in the exchange rate formation process again. But according to the Commitment of Traders (COT) reports, we can only conclude that the bearish mood is minimal and has not intensified in recent months. Nevertheless, taking into account the fundamental background, the euro may continue to fall. And the technical picture does not yet give any reason to assume the completion of the fall of the euro currency. The mood of the major players remains bearish, but at the same time the bulls do not seek to change anything.
Explanations for the chart:
Support and Resistance Levels are the levels that serve as targets when buying or selling the pair. You can place Take Profit near these levels.
Kijun-sen and Senkou Span B lines are lines of the Ichimoku indicator transferred to the hourly timeframe from the 4-hour one.
Support and resistance areas are areas from which the price has repeatedly rebounded off.
Yellow lines are trend lines, trend channels and any other technical patterns.
Indicator 1 on the COT charts is the size of the net position of each category of traders.
Indicator 2 on the COT charts is the size of the net position for the non-commercial group.
Le recensioni analitiche di InstaForex ti renderanno pienamente consapevole delle tendenze del mercato! Essendo un cliente InstaForex, ti viene fornito un gran numero di servizi gratuiti per il trading efficiente.

