 Rimani
Condizioni di trading
Strumenti


The United States was on a day off in light of the celebration of President's Day, while the volatility remained in the market. Probably, the general information and news background pushed speculators to action, which caused activity. At the same time, preliminary data on business activity indices in Europe and Great Britain were published, which also played a lever for the market.
Statistics details:
The eurozone manufacturing index turned out to be slightly worse than expected and as a result, fell from 58.7 to 58.4 points. Expected: 58.5 points.
The index of business activity in the EU services sector, instead of rising from 51.1 to 51.7 points, jumped to 55.8 points.
As a result, the composite business activity index of the EU rose from 52.3 to 55.8 points. While it was expected to grow only to 52.5 points.
In Britain, it was predicted that the index of business activity in the service sector will rise from 57.3 points to 57.6 points, but remained unchanged.
The manufacturing index rose from 54.1 to 60.8 points. Its growth was predicted only up to 55.0 points.
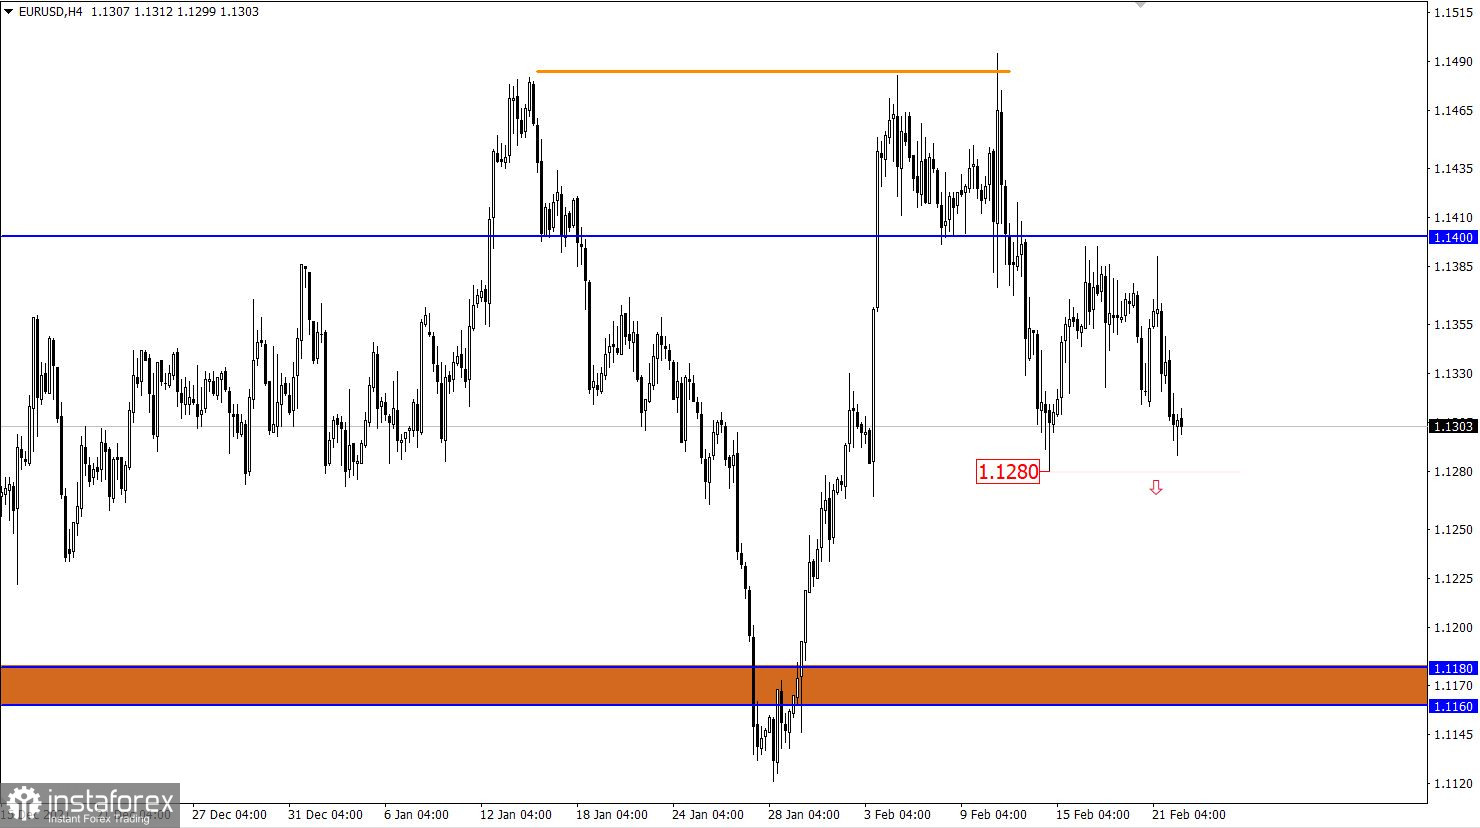
The EURUSD currency pair strengthened its downward movement from the resistance level of 1.1400, which indicates the prevailing interest of traders in short positions. As a result, the quote returned to the base area of the previous week.
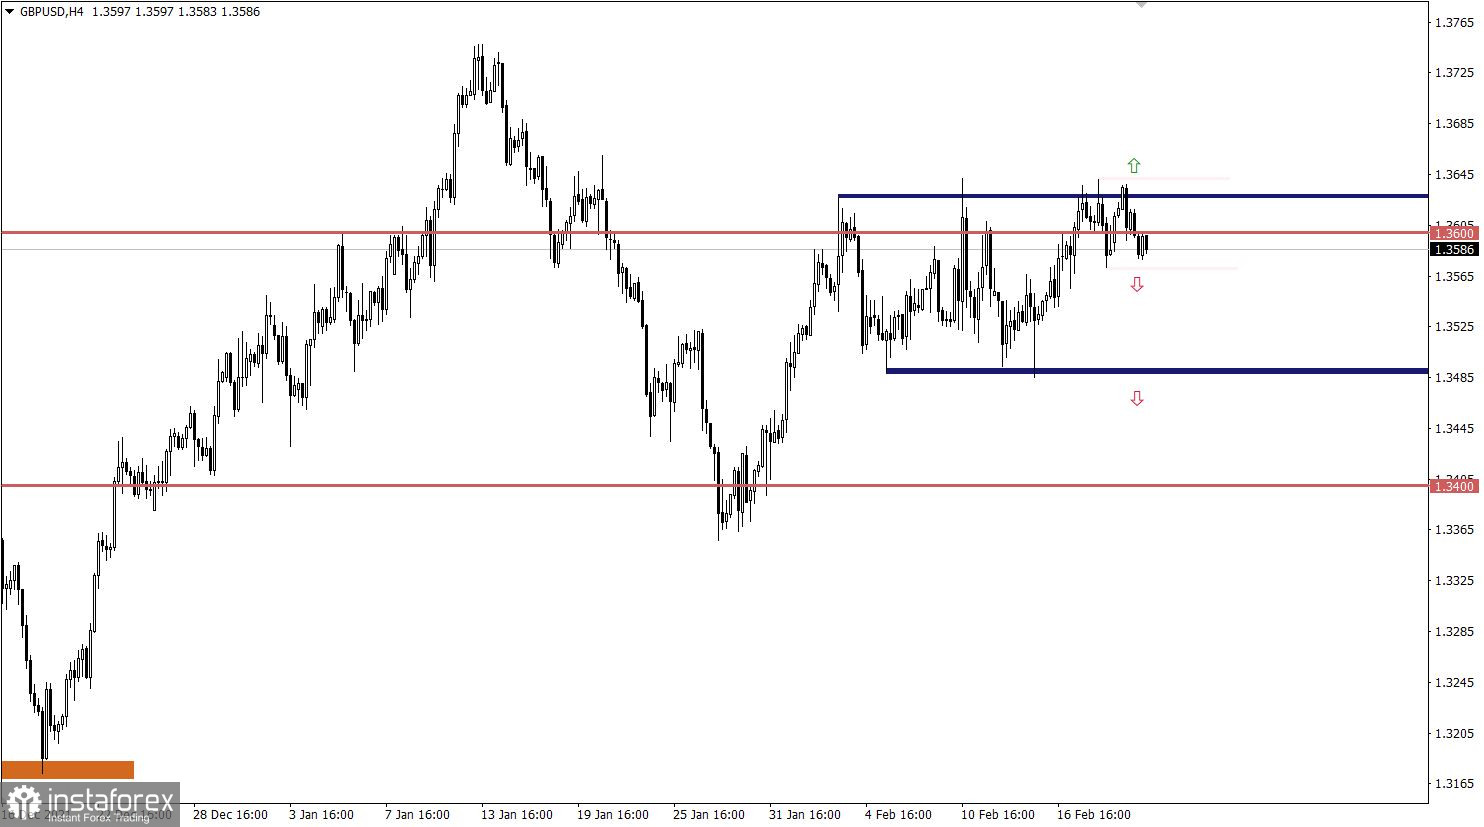
The GBPUSD currency pair has been moving for several days in a row within the deviation of the upper boundary of the side channel, eventually having a clear amplitude of 1.3580/1.3630. In fact, this move indicates the characteristic uncertainty of market participants in further actions, which leads to the process of accumulation of trading forces.
Today, a preliminary assessment of the business activity indices of the United States is expected to be published, which predicts the growth of the manufacturing index, as well as the index in the service sector. As a result, this may play a positive role in the U.S. dollar exchange rate.
In terms of information flow, it is worth keeping track of news, statements regarding new sanctions against the Russian Federation, which may well scare investors. This will lead to capital flight, where the U.S. dollar may well serve as a safe haven.
Time targeting
The index of business activity in the US manufacturing sector - 14:45 Universal time
The index of business activity in the US services sector - 14:45 Universal time
In this situation, downward interest still takes place in the market. Traders are considering a new round of growth in the volume of short positions if the price holds below the local low of February 14 at 1.1280. Thus, the U.S. dollar will have every chance to restore its positions relative to the recent corrective move.
In this situation, special attention is paid to the amplitude of 1.3580/1.3630, since the greatest interest from speculators will arise relative to it. Long-term holding of the price outside one or another boundary in a four-hour period will lead to the initial impulse. As a result, there will be a breakdown of the flat with the price moving to the maximum of January, or a reverse move along the trajectory of the lower boundary of the side channel 1.3600/1.3500 previously set on the market.
A candlestick chart view is graphical rectangles of white and black light, with sticks on top and bottom. When analyzing each candle in detail, you will see its characteristics of a relative period: the opening price, closing price, and maximum and minimum prices.
Horizontal levels are price coordinates, relative to which a stop or a price reversal may occur. These levels are called support and resistance in the market.
Circles and rectangles are highlighted examples where the price of the story unfolded. This color selection indicates horizontal lines that may put pressure on the quote in the future.
The up/down arrows are the reference points of the possible price direction in the future.
Le recensioni analitiche di InstaForex ti renderanno pienamente consapevole delle tendenze del mercato! Essendo un cliente InstaForex, ti viene fornito un gran numero di servizi gratuiti per il trading efficiente.

