 Rimani
Condizioni di trading
Strumenti


Long positions on EUR/USD:
In my forecast this morning, I drew your attention to the level of 1.1006 and recommended entering the market from it. Let's have a look at the 5-minute chart and analyze what happened. The weak IFO data from Germany disappointed investors because the report was much worse than economists forecasted. Against this backdrop, the euro plummeted to the support area at 1.1006, where bulls created a false breakout and an excellent buy signal to continue the pair's recovery. At the moment, the pair humped by more than 15 pips. Technically, nothing much has changed, as well as the plan for the second half of the day.
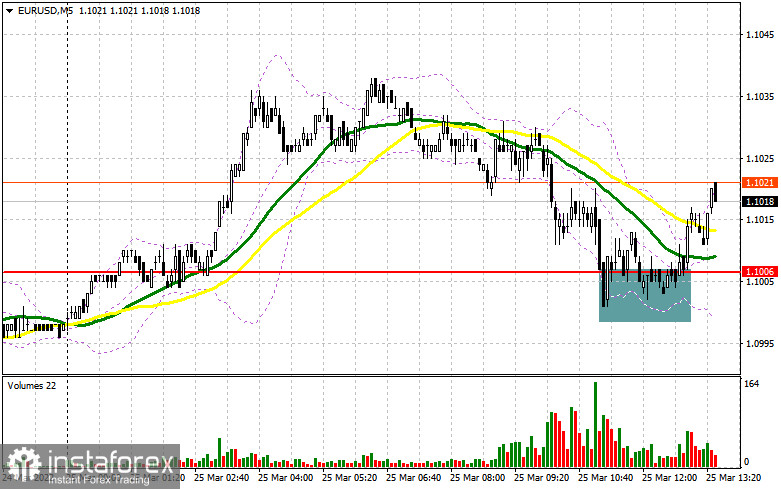
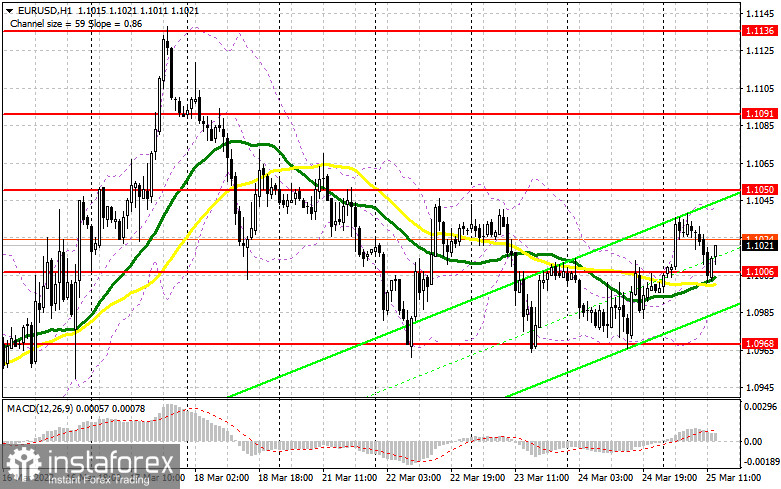
As noted above, the German business conditions indicator and the economic expectations indicator were so weak that even the most pessimistic economists did not expect such a sharp drop. Nevertheless, pressure on the euro was rather moderate. Due to geopolitical tensions, the readings might have been much worse. Today the press secretary of the President of the Russian Federation Dmitry Peskov said that it was too early to speak about the future of the negotiations on the security guarantees because the reality had changed and a serious reassessment was needed. What he meant by that is not clear yet, but it is definitely nothing good in his words. The possible prolongation of the negotiations by the Ukrainian authorities is the reason for this kind of statement. So far, the market has not reacted to all of this, but tensions are likely to gradually rise. This may hurt risky assets in the short term. Against this background, the bulls need to hold the price above support at 1.1006. They succeeded in the first half of the day. As long as trading is carried out above this level, we can expect a recovery of the euro to the new swing high at 1.1050. The repeated falling down to 1.1006 is unlikely to occur today because of the fundamental US statistics, as the report on home sales has no major impact on the currency market. If euro buyers do not continue to take active actions to strengthen the pair, only in this case we will see a test of 1.1006. I would not count on this level in the afternoon. Only a false breakout there, similar to the one I described above, may lead to a larger increase in the EUR/USD pair, with an upside target of 1.1050. A breakthrough and a test of this level are likely to create a buy signal and open the way to the pair's recovery to the area of 1.1091. The next target is the monthly high at 1.1136, where traders may lock in profits. A breakthrough of this range will cancel the bearish trend and trigger sellers' stop-loss orders, opening a direct way to the highs of 1.1181 and 1.1227. However, this scenario is unlikely to be implemented at the end of the week. If the pair declines and bulls are not so active at 1.1006, and that is where the moving averages are passing, which are playing on their side, it is better to postpone opening long positions. A false breakout of the low at 1.0968 would be the best buy scenario, but you can go long from 1.0928 on a rebound, allowing an upward intraday correction of 30-35 pips.
Short positions on EUR/USD:
Bears almost reached their main goal, as they only tested 1.1006 failing to consolidate below this level. If the pair rises in the afternoon, a false breakout at 1.1050 may trigger a sell signal with the target at the support of 1.1006. Considering this, there are not many US statistics during the US session, the lack of activity and a return to 1.1006 may ruin bulls' plans, forcing them to take profit at the end of the week. A reverse test bottom/top of this level is likely to create an additional signal for opening short positions, and there is also a chance of going back to the lower boundary of the sideways channel at 1.0968. A breakthrough of this level is likely to trigger some stop-orders of bulls, which will cause a nosedive to the higher levels at 1.0928 and 1.0891. Once the pair hits 1.0855, it would be better to lock in profits. If the euro grows and bears show weak activity at 1.1050, bulls may continue to build up long positions, counting on a return to the monthly highs. In such a case, it is best not to hurry up with selling the pair. It is also possible to open short positions if a false breakout at 1.1091 occurs. Selling the EUR/USD on the rebound is possible from 1.1136, or higher at 1.1181, allowing a downward correction of 20-25 pips.
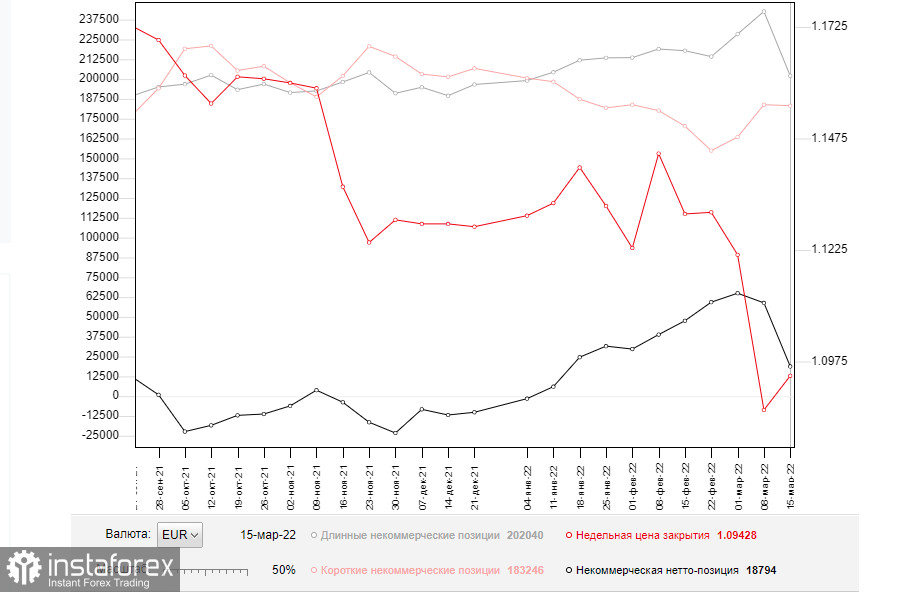
The COT (Commitment of Traders) report for March 15 showed a decrease in both long and short positions. However, if you look at the readings, you can see that the reduction of short positions was only slight, unlike the long ones, which slumped significantly. This was not surprising, against the background of the Russian special military operation in Ukraine. The Federal Reserve meeting was the central event of last week. As a result, the committee raised interest rates by 0.25%, which did not lead to serious changes in the market, as many had expected such decisions. Fed Chairman Jerome Powell took a wait-and-see approach during his speech, failing to signal a more aggressive policy, which triggered a build-up of long positions in risky assets. However, at the beginning of this week, the Fed Chairman changed his approach saying in the interview that there was a high probability of a 0.5% point hike at the next FOMC meeting. It was a strong bullish signal for USD, which is likely to continue its rise against the euro. Recently, the European Central Bank also held a meeting. President Christine Lagarde announced plans for a more aggressive tapering of economic support measures and interest rate hikes. It turned out to be good for the medium-term outlook of the European currency, which is already heavily oversold against the US dollar. The COT report showed that long non-commercials fell to 202,040 from 242,683, while short non-commercials declined to 183,246 from 183,839. At the end of the week, total non-commercial net positioning was down to 18,794 against 58,844. The weekly closing price rose slightly to 1.0942 from 1.0866.
Signals of indicators:
Moving Averages
Trading is conducted above the 30- and 50-day moving averages, which indicates the sideways market.
Note: The period and prices of moving averages are considered by the author on the one-hour chart that differs from the general definition of the classic daily moving averages on the daily chart.
Bollinger Bands
If the price rises, the upper boundary of the indicator located at 1.1015 will act as a resistance level. A breakthrough of the lower boundary at 1.0970 is likely to cause a larger sell-off in the euro.
Description of indicators
Le recensioni analitiche di InstaForex ti renderanno pienamente consapevole delle tendenze del mercato! Essendo un cliente InstaForex, ti viene fornito un gran numero di servizi gratuiti per il trading efficiente.

