 Rimani
Condizioni di trading
Strumenti


The EUR/USD pair showed a good downward movement and good volatility on Monday. The most important thing is that there was a trend movement on Monday, which always allows traders to make good money. There were no important fundamental or macroeconomic events either in the United States or in the European Union, but, as it turns out, they are not needed now. Last Friday, the market did not pay any attention to important reports on Non-farms, unemployment and inflation, but on Monday it traded very actively with an empty calendar. However, there was still news that turned out to worsen the mood of traders. It became known that in the coming days, the Russian troops who left the territory of the Kiev and Zhytomyr regions will be relocated to Donbas and, most likely, the "second phase of the special operation" will begin there. Military experts around the world expect an escalation of the conflict in the coming days and new battles between the Ukrainian and Russian armies. This could trigger a new fall in the euro on Monday.
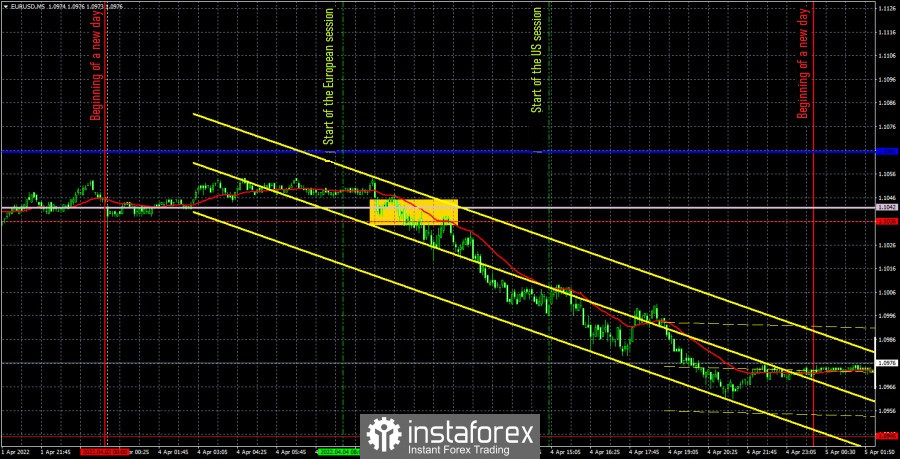
As for trading signals, there was only one, but it was very good. At the beginning of the European trading session, the pair overcame the Senkou Span B line and the extreme level of 1.1036, so traders could open short positions. The downward movement continued throughout the day, but it was not possible to reach the level of 1.0945. Therefore, the transaction should have been closed manually in the late afternoon. The profit on it was at least 40 points.
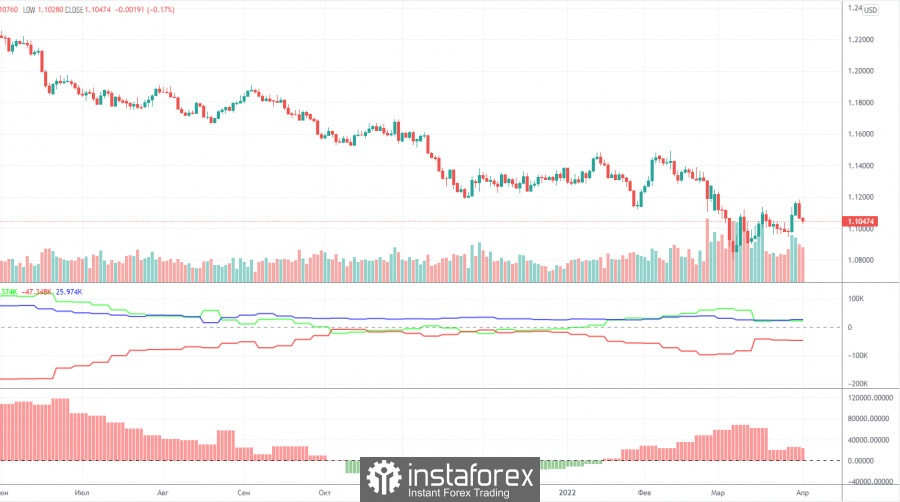
The latest, Commitment of Traders (COT) report turned out to be as neutral as possible and did not show any serious changes in the mood of professional traders. The non-commercial group closed about 7,000 contracts long positions and 4,500 short positions during the reporting week. The net position of this group decreased by 2,500. At the same time, the total number of long positions still exceeds the total number of short positions of major players. That is, their mood is still bullish, although the euro has been falling for 14-15 months. Earlier, we have already drawn attention to the fact that in January and February, major players increased longs on the euro currency. In theory, this should have led to the growth of the currency itself. However, the euro did not show anything other than the usual slight correction. Since it was in January-February, when the geopolitical situation in the world and in Europe began to deteriorate sharply, we assume that at that time the demand for the US dollar was growing very much. That is why there was an increase in the euro/dollar pair, despite the fact that the demand for euros among market participants was also growing. The demand for the dollar just grew faster and stronger. Now the factor of geopolitics remains in force, therefore, with the bullish mood of the major players, it is quite possible to expect a new fall in the European currency. To some extent, this is a paradox, but a paradox explained by the current circumstances that have developed in the world.
Overview of the EUR/USD pair. April 5. The euro currency is preparing for an oil embargo.
Overview of the GBP/USD pair. April 5. The British pound reacts less to geopolitics than the euro.
Forecast and trading signals for GBP/USD on April 5. Detailed analysis of the movement of the pair and trading transactions.
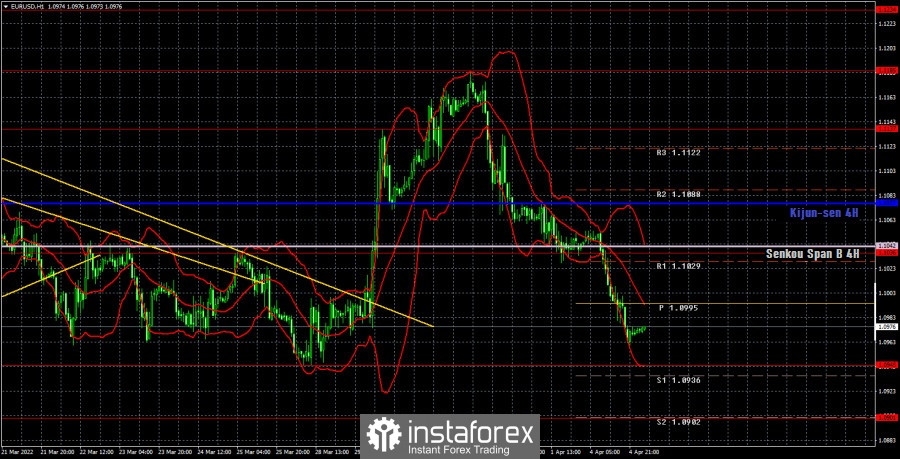
It is clearly visible on the hourly timeframe that there is no trend now. The euro rose sharply last week, but on Thursday the reverse movement began, which continues at this time. The pair has almost fallen to last week's lows, on overcoming which the future fate of the euro currency will depend. Since there will be few macroeconomic events this week, focus is on geopolitics. It is extremely difficult to predict news on this topic, so you need to carefully monitor all the data. We allocate the following levels for trading on Tuesday – 1.0901, 1.0945, 1.1036, 1.1137, 1.1185, 1.1234, as well as the Senkou Span B (1.1042) and Kijun-sen (1.1077) lines. The lines of the Ichimoku indicator can move during the day, which should be taken into account when determining trading signals. There are also support and resistance levels, but no signals will be formed near them. Signals can be "bounces" and "breakthrough" levels - extremes and lines. Do not forget about placing a Stop Loss order at breakeven if the price went in the right direction of 15 points. This will protect you against possible losses if the signal turns out to be false. The European Union and the United States are scheduled to publish indices of business activity in the service sectors on April 5. We believe that these reports are absolutely unimportant now, and the US dollar can become more expensive without the help of statistics. Therefore, almost any important news concerning the geopolitical conflict in Ukraine will be of greater importance.
Support and Resistance Levels are the levels that serve as targets when buying or selling the pair. You can place Take Profit near these levels.
Kijun-sen and Senkou Span B lines are lines of the Ichimoku indicator transferred to the hourly timeframe from the 4-hour one.
Support and resistance areas are areas from which the price has repeatedly rebounded off.
Yellow lines are trend lines, trend channels and any other technical patterns.
Indicator 1 on the COT charts is the size of the net position of each category of traders.
Indicator 2 on the COT charts is the size of the net position for the non-commercial group.
Le recensioni analitiche di InstaForex ti renderanno pienamente consapevole delle tendenze del mercato! Essendo un cliente InstaForex, ti viene fornito un gran numero di servizi gratuiti per il trading efficiente.

