 Rimani
Condizioni di trading
Strumenti


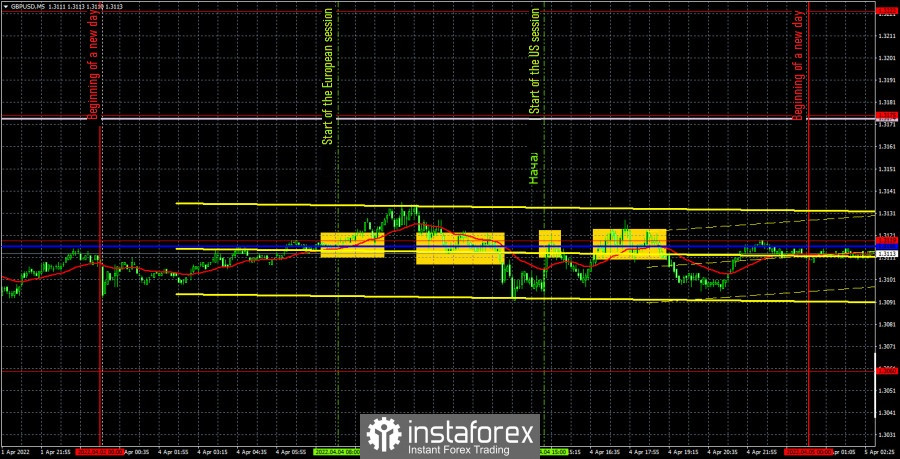
The GBP/USD currency pair was trading in such a way that at least you could have not opened a trading terminal. The volatility of the pair during the day amounted to an anti-record 44 points. An absolute flat was observed all day. There were no important events and publications during the day. The speech of Bank of England Governor Andrew Bailey was supposed to take place, but he again did not please traders with any important information. Otherwise, there would have been a reaction to his speech. Thus, the pound continues to remain in the "risk zone" due to the difficult geopolitical situation in Ukraine, but on Monday, unlike the euro, it showed no interest in a new fall. We think this is temporary. If, as military experts predict, the second phase of the "special operation" begins in the coming days, during which Russian troops try to capture Kharkiv and Donetsk and Luhansk regions, this could lead to a new fall in risky currencies. Such as the euro and the pound.
Four trading signals were generated yesterday. Everything is near the extreme level of 1.3119 and the Kijun-sen line, which were located at a distance of three points from each other. Recall that one of the signs of a flat is the formation of all signals near one level or line. The first buy signal turned out to be false, and the price could not go up even 10 points. Therefore, the long position closed at a loss. The second sell signal also turned out to be false, as the pair could not go down even 20 points. Neither in the first nor in the second case was it possible to set the Stop Loss to breakeven. However, the second transaction still managed to avoid a loss, as the pair could not settle above the level of 1.3119. Consequently, until the evening, traders had to maintain short positions, and eventually close them at zero.
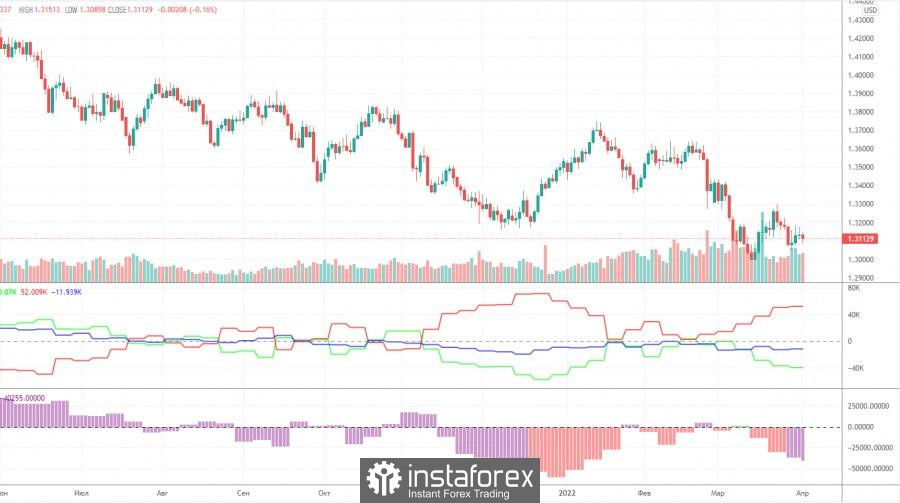
The latest Commitment of Traders (COT) report on the British pound showed minimal changes in the mood of major players. For a whole week, the non-commercial group opened only 700 short positions and closed 2,100 long positions. Thus, the net position of non-commercial traders decreased by 3,000. Even for the pound, such changes are insignificant. In general, the non-commercial group has almost 2.5 times more contracts for short positions than for longs. This means that the mood of professional traders is now "very bearish". Thus, this is another factor that speaks in favor of the continuation of the fall of the British currency. The situation with COT reports for the pound is completely different than for the euro. According to the pound, the mood of the major players changes every couple of months, and sometimes even faster. At this time, the "non-commercial" net position has already fallen to the levels where the last round of the pound's fall ended (the green line on the first indicator). Thus, we can even assume that in the coming weeks the pound will try to start a new ascent. However, much will again depend on geopolitics and technique. At the moment, the pound has a little more reason to grow than the euro. But there are plenty of factors of the fall.
Overview of the EUR/USD pair. April 5. The euro currency is preparing for an oil embargo.
Overview of the GBP/USD pair. April 5. The British pound reacts less to geopolitics than the euro.
Forecast and trading signals for EUR/USD on April 5. Detailed analysis of the movement of the pair and trading transactions.
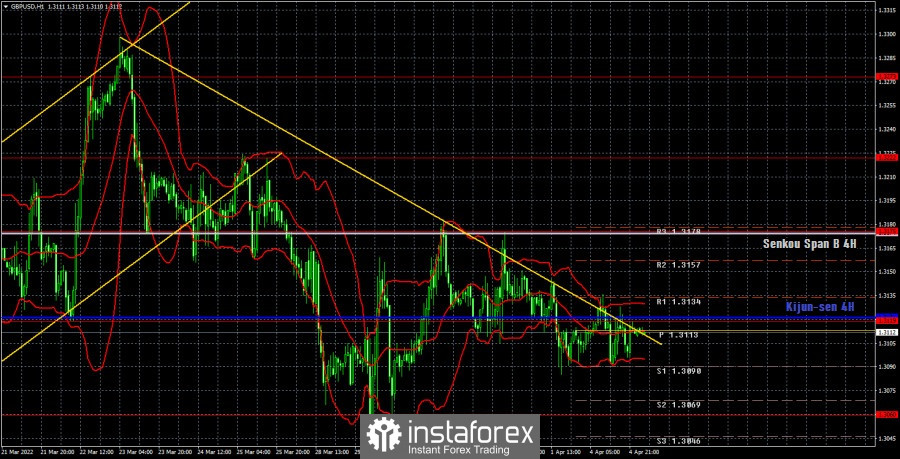
It is clearly visible on the hourly timeframe that the pair has not been able to determine the direction of movement for several weeks. The upward momentum ended very quickly near the level of 1.3175, and at the moment the price is below both lines of the Ichimoku indicator, so a further fall in the British currency is preferable. We expect to see the pair near the 1.3060 level in the near future. The descending trend line, oddly enough, still remains relevant, although the price only broke through it twice yesterday. But it still remains below it. We highlight the following important levels on April 5: 1.3000, 1.3060, 1.3119, 1.3175, 1.3222. The Senkou Span B (1.3174) and Kijun-sen (1.3121) lines can also be signal sources. Signals can be "bounces" and "breakthroughs" of these levels and lines. It is recommended to set the Stop Loss level to breakeven when the price passes in the right direction by 20 points. The lines of the Ichimoku indicator can move during the day, which should be taken into account when determining trading signals. There are also support and resistance levels on the chart that can be used to take profits on transactions. Business activity indices in the service sectors are scheduled to be published in the UK and the US on Tuesday. We believe that in the current circumstances, these data have almost no significance for the market. The pair will trade based on technique and geopolitics today.
Support and Resistance Levels are the levels that serve as targets when buying or selling the pair. You can place Take Profit near these levels.
Kijun-sen and Senkou Span B lines are lines of the Ichimoku indicator transferred to the hourly timeframe from the 4-hour one.
Support and resistance areas are areas from which the price has repeatedly rebounded off.
Yellow lines are trend lines, trend channels and any other technical patterns.
Indicator 1 on the COT charts is the size of the net position of each category of traders.
Indicator 2 on the COT charts is the size of the net position for the non-commercial group.
Le recensioni analitiche di InstaForex ti renderanno pienamente consapevole delle tendenze del mercato! Essendo un cliente InstaForex, ti viene fornito un gran numero di servizi gratuiti per il trading efficiente.

