 Rimani
Condizioni di trading
Strumenti


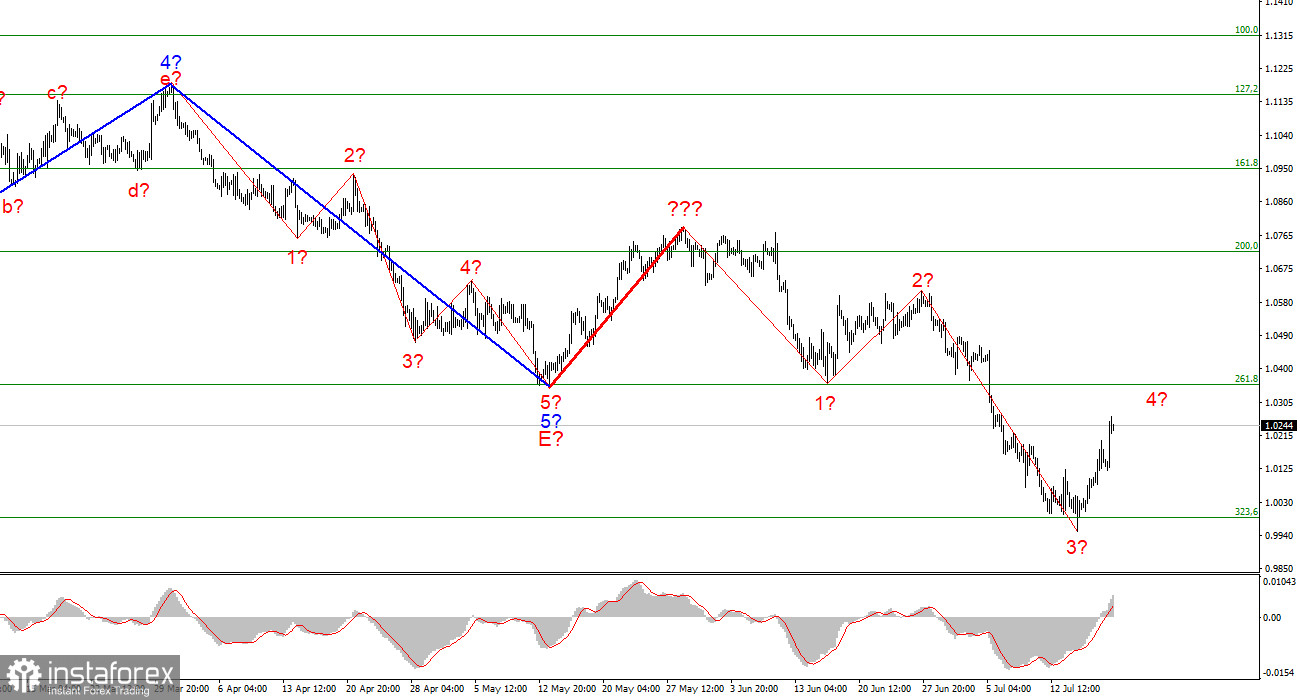
A few weeks ago, the wave markings on the 4-hour chart for the euro/dollar instrument got more complex and no longer had a holistic appearance. There was a successful attempt to break through the 261.8 percent Fibonacci level, which was also the low of the waves E and b; hence, these waves are no longer E and b. Thus, I have constructed a new wave markup that does not yet account for the ascending wave indicated by a bold red line. I've already stated that the entire wave structure can be complicated indefinitely. It is the drawback of wave analysis, as any structure is always capable of assuming a more complicated and extensive shape.
Consequently, I propose to now focus on simpler wave structures, including waves of a smaller scale. As can be seen, the formation of an upward wave, which may be wave 4 of a new downward trend segment, has begun. If this prediction is right, the instrument's drop will resume within wave 5 with objectives positioned below 1.0000 after an additional 100-150 basis points gain. So far, I see no reason to anticipate additional instrument moves.
Thursday is the day for the ECB meeting.
Tuesday saw the euro/dollar pair increase by another 100 basis points. So far this week, the European currency has gained as much as 230 points, which has not occurred in a very long time. There may be inquiries as to why the euro began to be in demand this week. And you may find the answers to these questions in the news calendar. Today, the European Union published a report on inflation for June, revealing another rise in the indicator. This time rose 8.6% year-over-year. It should be noted that after the announcement of this data, the European currency fell only marginally, when just a few hours earlier, it had risen significantly.
Nonetheless, I maintain that these are two linked occurrences. If this is not the case, there is a second significant component that cannot go overlooked. This component is the ECB meeting, whose outcomes will be summarized on Thursday.
A few days before the conclusion of the meeting, the market is full of diverse predictions and speculations. No one doubts that the interest rate will be increased by 25 basis points, as the question of a rate increase appears to have been resolved. However, since the beginning of this week, there have been rumblings that the ECB may hike the rate by 50 basis points all at once. Today, due to the publication of a study detailing another spike in inflation, these beliefs have grown stronger. The market is pretty reasonable in this regard: the higher the inflation, the greater the likelihood of a sharper increase in interest rates. I'd want to remind you that the ECB rarely presents surprises. Christine Lagarde clarified that we are discussing a 25-point hike in July and the same amount in September. I believe there is no need to add anything unnecessary to this discussion.
General conclusions
I infer based on my findings that construction of the downward trend segment continues. Consequently, it is now viable to sell the instrument with goals near the predicted mark of 0.9397, which corresponds to 423.6 percent Fibonacci, for each "down" MACD signal, based on the building of wave 5. A failed effort to surpass the level of 323.6 percent signals the temporary unavailability of the market for new sales and the commencement of the construction of corrective wave 4. Consequently, you may also await the conclusion of this wave before resuming sales.
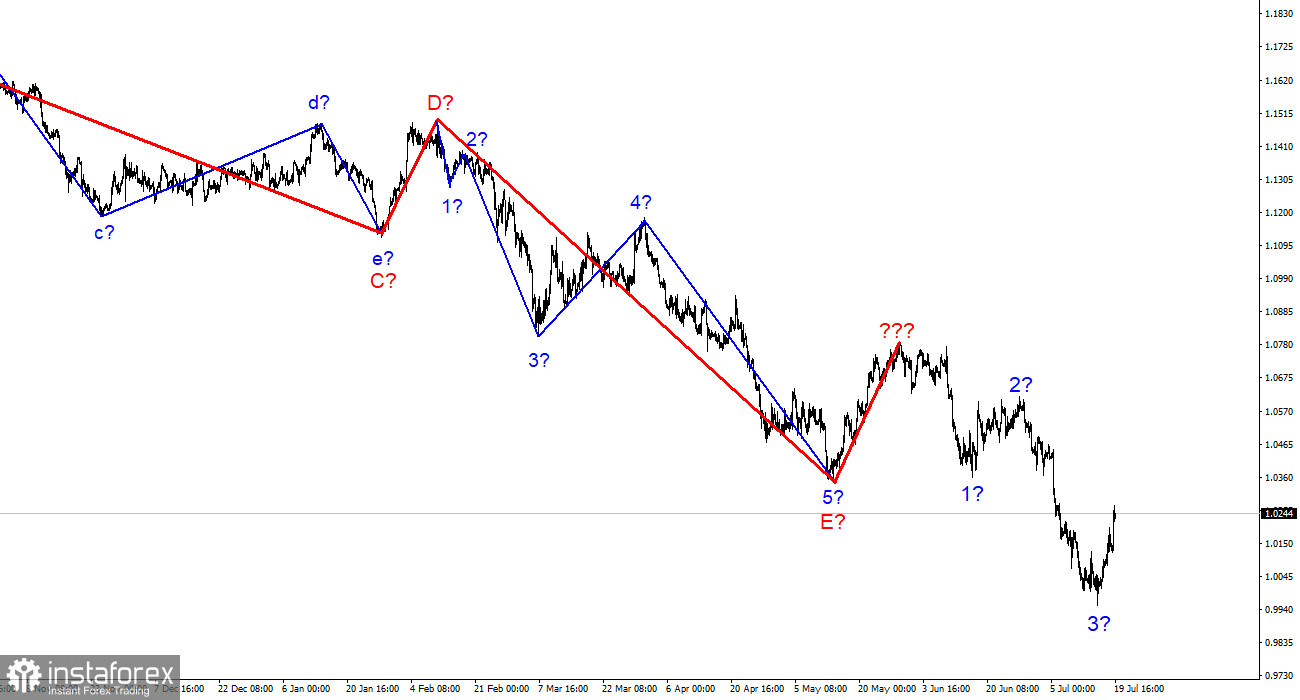
At the larger wave size, the wave marking of the descending trend segment becomes considerably more complex and extends in length. It can assume virtually any length. Thus I believe it is best to concentrate and focus on three and five-wave conventional wave structures at this time.
Le recensioni analitiche di InstaForex ti renderanno pienamente consapevole delle tendenze del mercato! Essendo un cliente InstaForex, ti viene fornito un gran numero di servizi gratuiti per il trading efficiente.


