 Rimani
Condizioni di trading
Strumenti


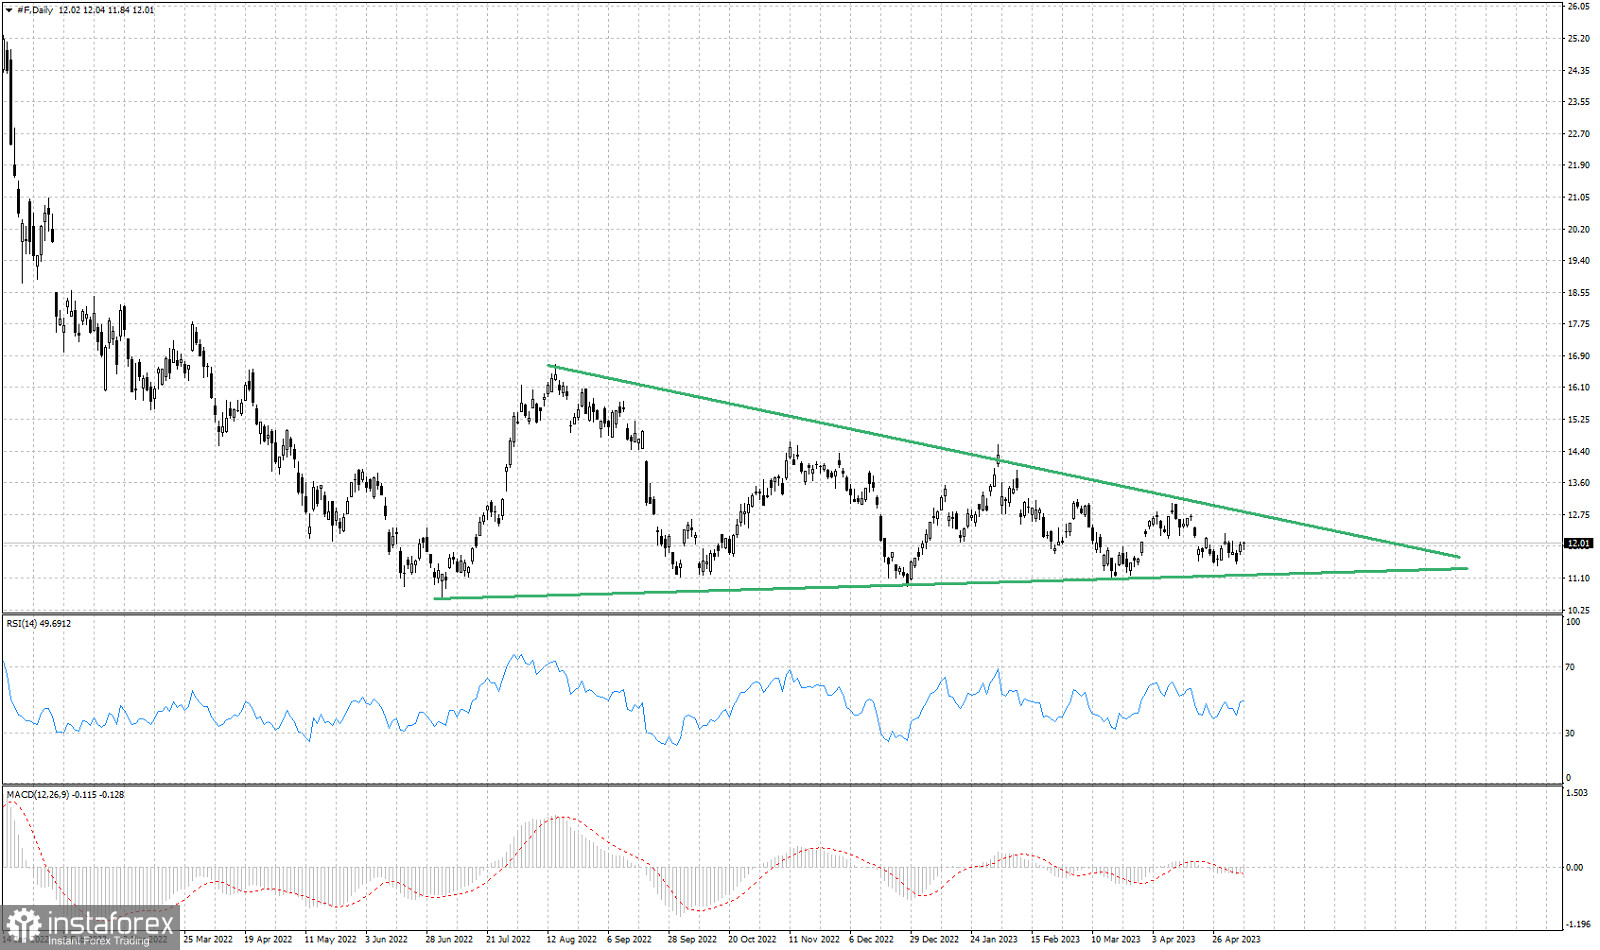
Green lines- triangle pattern
Over the last 9 months, Ford's stock price has been trading in a relatively narrow range between $7.50 and $12.50. During this period, the stock has formed a triangle pattern on the daily chart, with the upper trendline connecting the highs and the lower trendline connecting the lows. The triangle pattern suggests that Ford's stock price is consolidating and that a breakout may be imminent. If the stock breaks above the upper trendline, it could signal a bullish continuation and a potential move towards the $13.50 to $14.00 range. On the other hand, if price breaks below the lower trendline, it could signal a bearish reversal and a potential move towards the $6.50 to $7.00 range. The Relative Strength Index (RSI) is currently hovering around the midpoint, indicating that the stock is neither overbought nor oversold. The Moving Average Convergence Divergence (MACD) indicator is also showing a neutral signal, with the MACD line and signal line crossing each other multiple times over the past few months. Overall, the technical outlook for Ford's stock price remains uncertain as it continues to trade within the triangle pattern. Traders and investors should keep a close eye on the upper and lower trendlines for potential breakout signals.
Le recensioni analitiche di InstaForex ti renderanno pienamente consapevole delle tendenze del mercato! Essendo un cliente InstaForex, ti viene fornito un gran numero di servizi gratuiti per il trading efficiente.

