 Rimani
Condizioni di trading
Strumenti


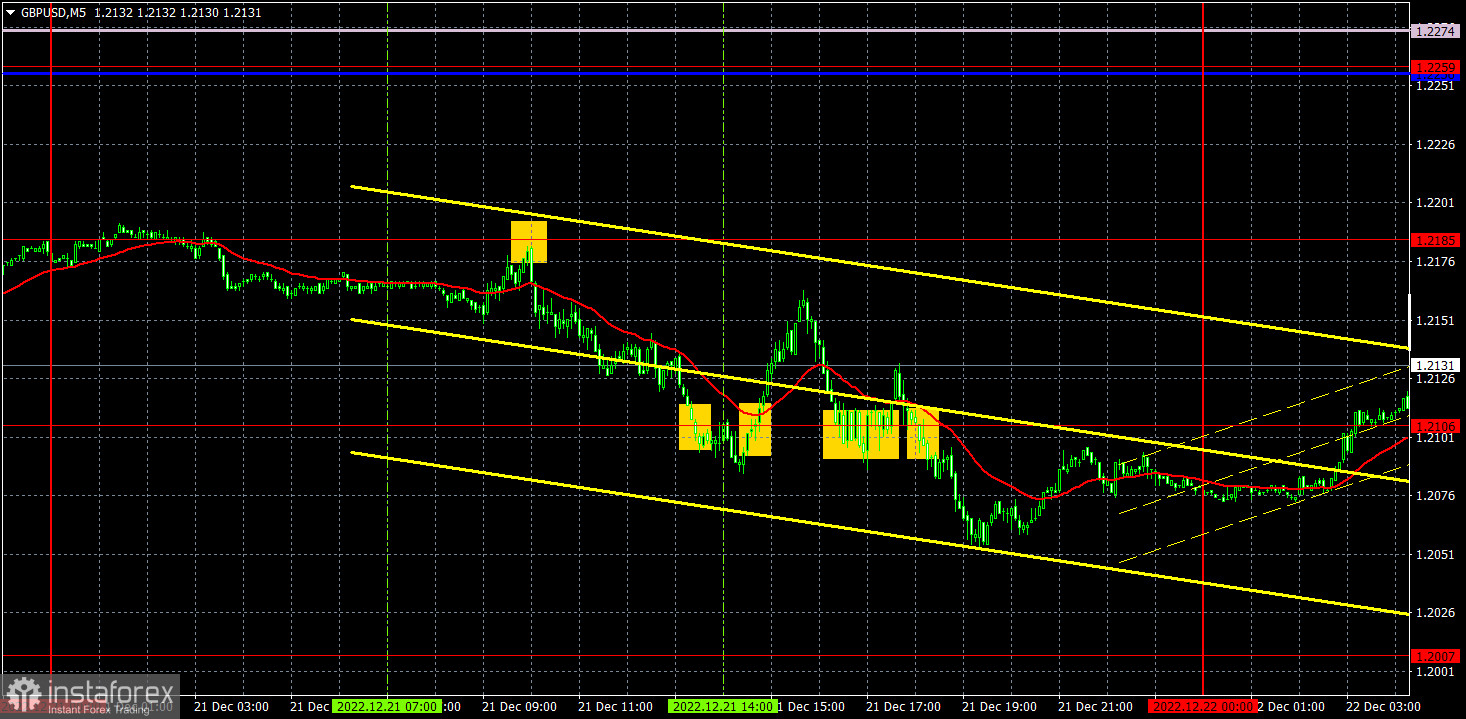
On Wednesday, GBP/USD continued a not so strong downward movement, which seems like a flat. The price often reverses against the trend and rolls back up. And these pullbacks and corrections are very difficult to predict, because the lines are starting to get worse and there is no fundamental and macroeconomic background. So, at least, we have some trend movement, but it is not easier to trade in it than in the flat. Nonetheless, the British currency is correcting somehow, which is what I have been waiting for for more than 3 weeks. This is still better than if the pair stood in one place and formed bundles of false signals in an absolute flat. The end of the week may turn out to be a little more interesting than its first half, since at least some reports will be published in the UK and the US.
Speaking of trading signals, the situation wasn't the worst. The very first signal near 1.2185 was formed with minimal error, so traders could open short positions. Later, the price fell below 1.2106, but quickly returned to the area above it, so the short should have been closed while longs should have been opened. We managed to earn about 50 pips on it. It was not possible to gain anything using the longs since the pair failed to reach the target level, but it passed in the right direction by 20 points, so a Stop Loss should have been set to Breakeven. The next buy signal also turned out to be false, but the price did not pass the necessary 20 points, so you could lose on this position. The next signal near 1.2106 should have been ignored. All in all, you could end the day with a bit of profit.
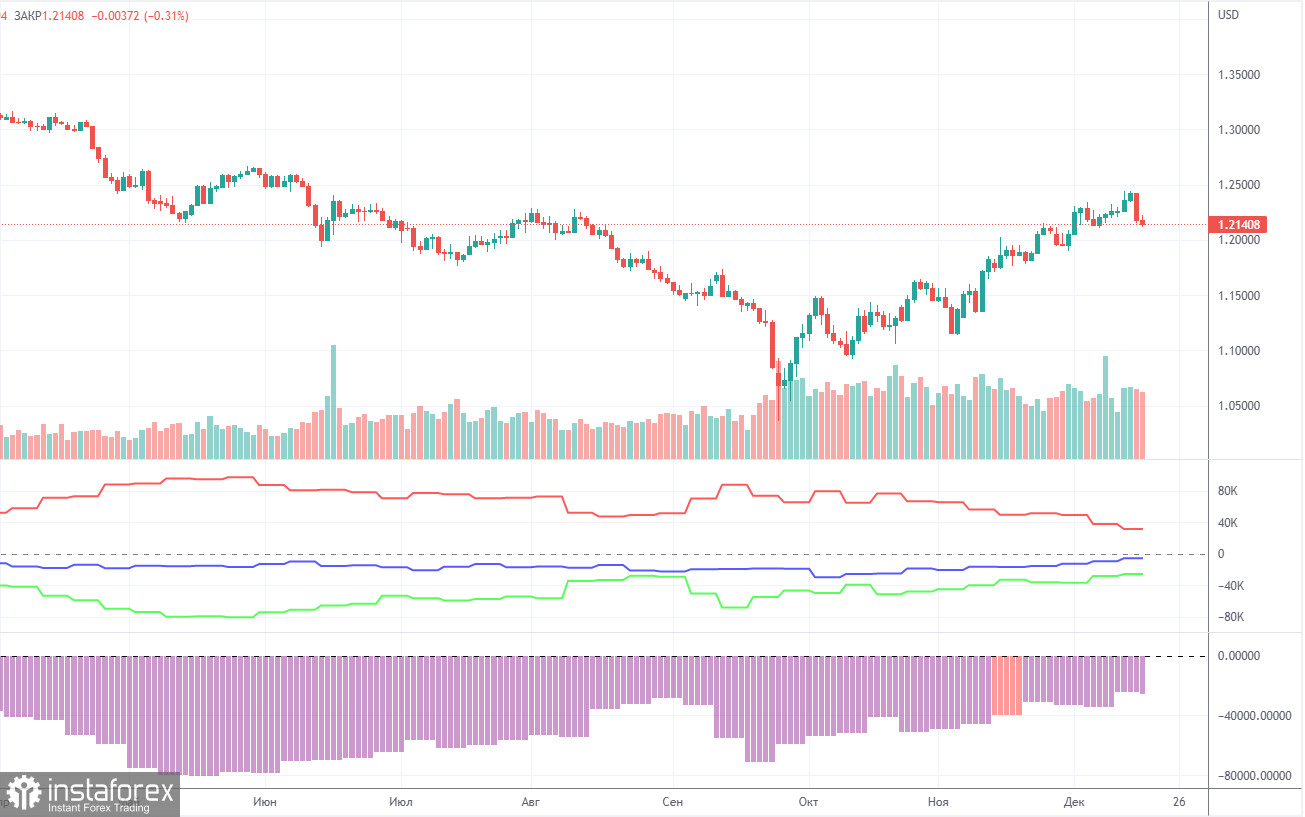
The latest COT report showed a decrease in bearish sentiment. During the given period, non-commercial traders opened 3,500 long positions and 1,000 short positions. The net position grew by about 2,500. This figure has been on the rise for several months. Nevertheless, sentiment remains bearish, and GBP/USD is on the rise for no reason. We assume that the pair may well resume the downtrend soon. Notably, both GBP/USD and EUR/USD now show practically identical movement. However, the net position on EUR/USD is positive and negative on GBP/USD. Non-commercial traders now hold 58,000 short positions and 32,000 long ones. The gap between them is still wide. As for the total number of open longs and shorts, the bulls have a 5,000 advantage here. Technical factors indicate that the pound may move in an uptrend in the long term. At the same time, fundamental and geopolitical factors signal that the currency is unlikely to strengthen significantly.
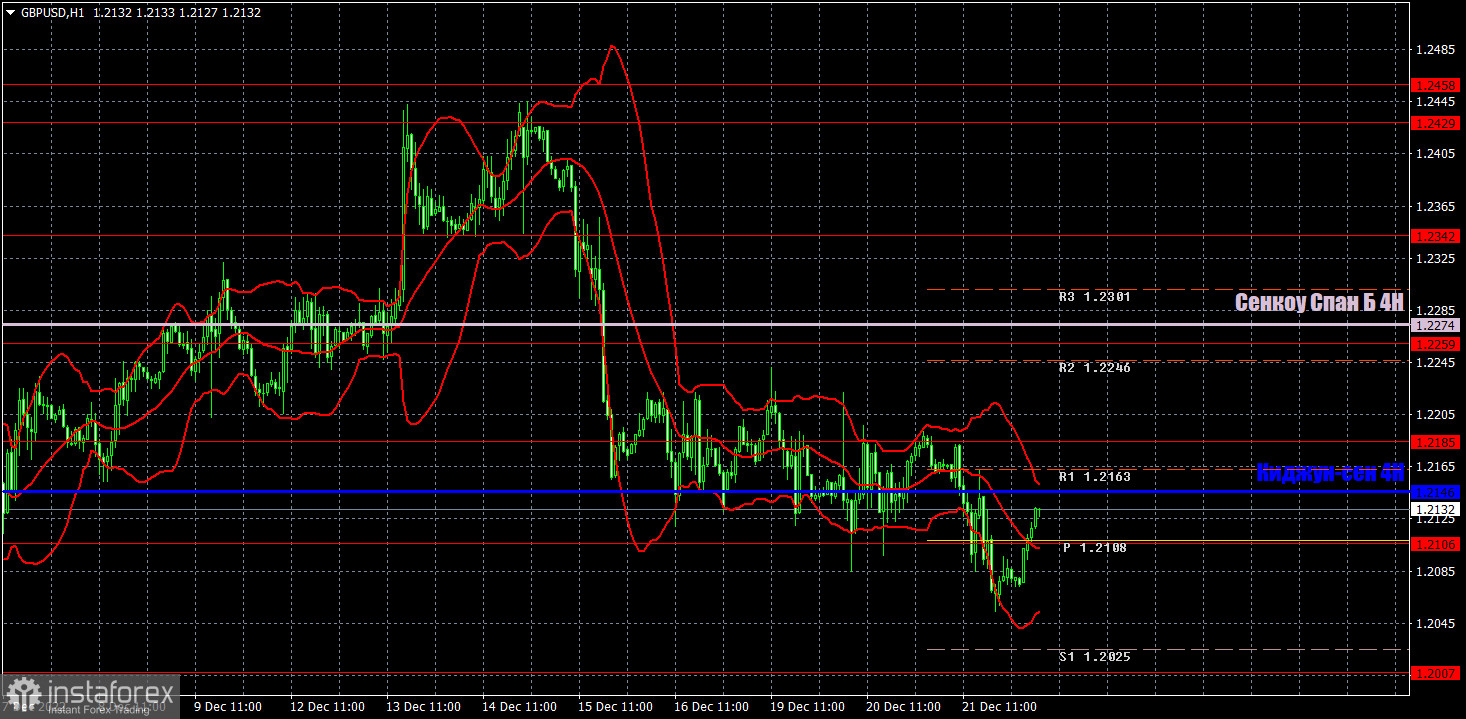
On the one-hour chart, GBP/USD is still trading below the lines of the Ichimoku indicator. Therefore, the downtrend persists, but the pound is moving down in a "shaky" manner, so it is not always possible to make a profit. Also, GBP might go into a flat soon. On Thursday, the pair may trade at the following levels: 1.1874, 1.1974-1.2007, 1.2106, 1.2185, 1.2259, 1.2342, 1.2429-1.2458. The Senkou Span B (1.2274) and Kijun Sen (1.2146) lines may also generate signals. Pullbacks and breakouts through these lines may produce signals as well. A Stop Loss order should be set at the breakeven point after the price passes 20 pips in the right direction. Ichimoku indicator lines may move during the day, which should be taken into account when determining trading signals. In addition, the chart does illustrate support and resistance levels, which could be used to lock in profits. Today, the UK and the US will publish their third quarter GDP reports. Therefore, the market might show a bit of reaction, but only if the results deviate from the forecasts.
Price levels of support and resistance are thick red lines, near which the movement may end. They do not provide trading signals.
The Kijun-sen and Senkou Span B lines are the lines of the Ichimoku indicator, moved to the one-hour chart from the 4-hour one. They are strong lines.
Extreme levels are thin red lines from which the price bounced earlier. They provide trading signals.
Yellow lines are trend lines, trend channels, and any other technical patterns.
Indicator 1 on the COT charts reflects the net position size of each category of traders.
Indicator 2 on the COT charts reflects the net position size for the non-commercial group.
Le recensioni analitiche di InstaForex ti renderanno pienamente consapevole delle tendenze del mercato! Essendo un cliente InstaForex, ti viene fornito un gran numero di servizi gratuiti per il trading efficiente.


