 Rimani
Condizioni di trading
Strumenti


GBP/USD was trading with a downward bias on Thursday. If a few days before that, the pound was weakening solely due to technical reasons, then yesterday it seems that it fell because of macro data. The UK and the US both released their GDP reports. Previously, I didn't think that there would be a strong reaction to such data, but to think, these reports were the reason for the pound's downfall. The pound was rising very often last month, a strong bearish correction is in place, so the pound would've fallen anyway even without the macro data. However, the US GDP grew more than the experts' forecasts and the UK GDP shrank more than the experts' forecasts. Thus, these reports provided additional support to the US currency, which strengthened during the day by more than 100 points.
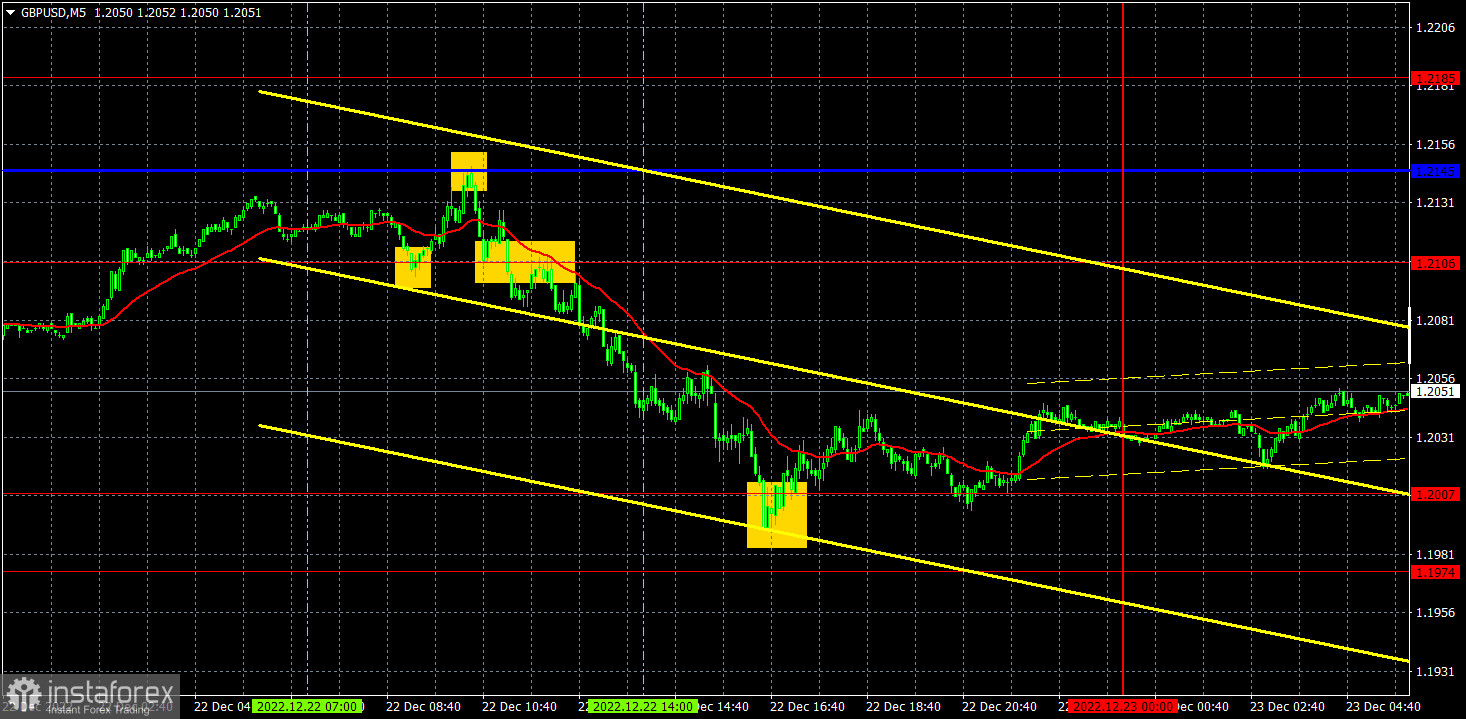
Speaking of trading signals, everything was fine. First, the price rebounded from 1.2106 and rose to the critical line. You can get around 10 pips of profit using the long position. The rebound from the Kijun-Sen line has triggered a spiral of decline, and GBP passed 1.2106 and fell to the area of 1.1974-1.2007, from which it rebounded. Hence, short positions should have been closed there, and the profit was about 100 pips. The rebound from the area could be used as a buy signal, but it brought only 10 pips of profit, as the pair could not start a new upward movement. Anyway, three deals were opened and all three were profitable.
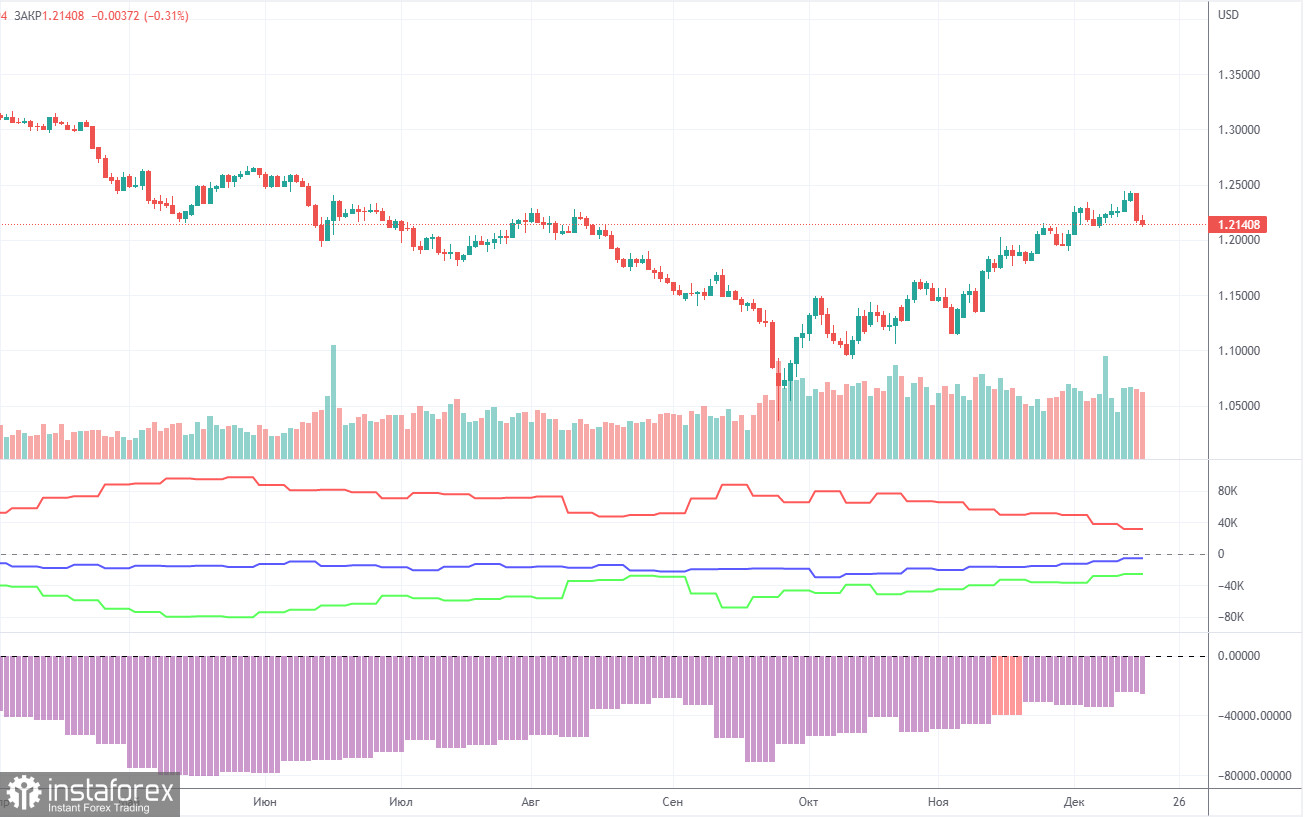
The latest COT report showed a decrease in bearish sentiment. During the given period, non-commercial traders opened 3,500 long positions and 1,000 short positions. The net position grew by about 2,500. This figure has been on the rise for several months. Nevertheless, sentiment remains bearish, and GBP/USD is on the rise for no reason. We assume that the pair may well resume the downtrend soon. Notably, both GBP/USD and EUR/USD now show practically identical movement. However, the net position on EUR/USD is positive and negative on GBP/USD. Non-commercial traders now hold 58,000 short positions and 32,000 long ones. The gap between them is still wide. As for the total number of open longs and shorts, the bulls have a 5,000 advantage here. Technical factors indicate that the pound may move in an uptrend in the long term. At the same time, fundamental and geopolitical factors signal that the currency is unlikely to strengthen significantly.
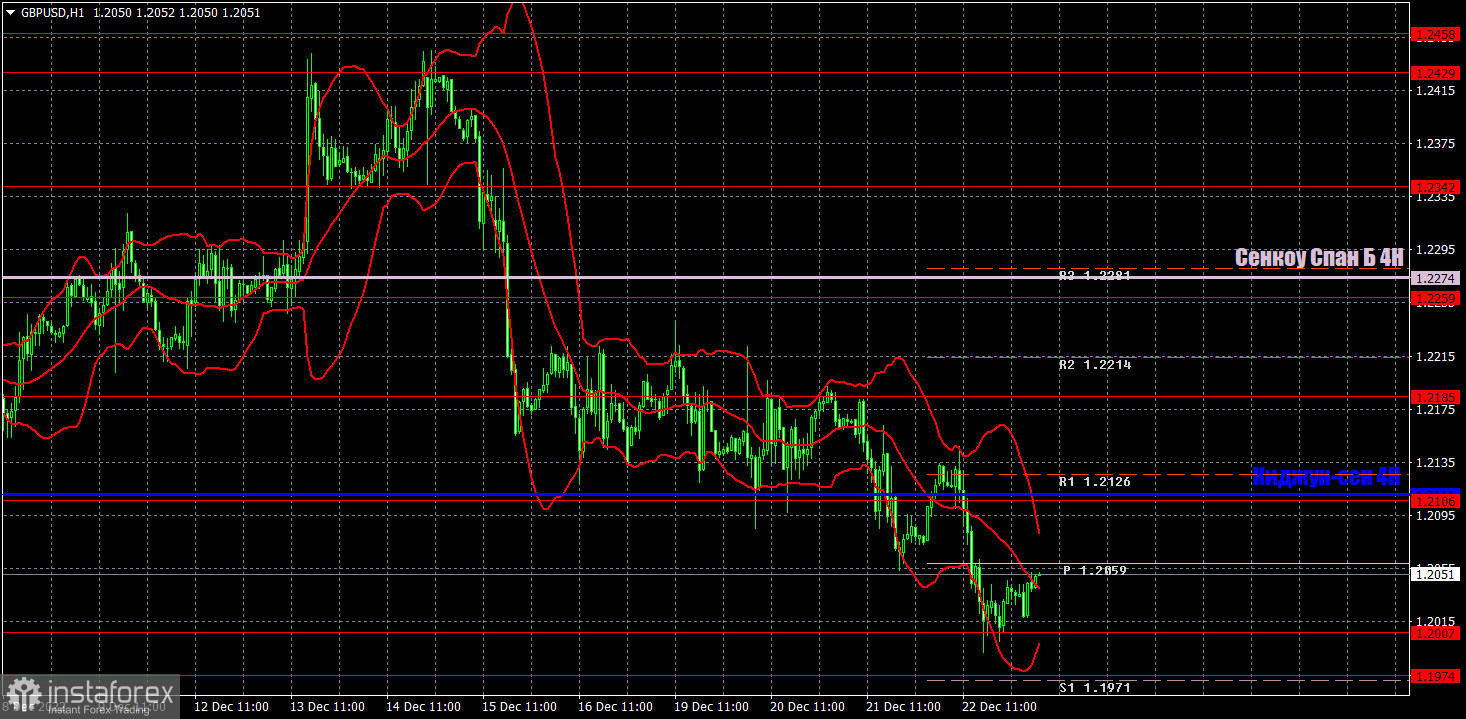
On the one-hour chart, GBP/USD is still trading below the lines of the Ichimoku indicator. Therefore, the downtrend persists, and the pound makes good use of New Year's Eve, since a bearish correction has been long overdue. Also, GBP might go into a flat soon. On Friday, the pair may trade at the following levels: 1.1760, 1.1874, 1.1974-1.2007, 1.2106, 1.2185, 1.2259. Senkou Span B (1.2274) and Kijun Sen (1.2111) lines may also generate signals. Pullbacks and breakouts through these lines may produce signals as well. A Stop Loss order should be set at the breakeven point after the price passes 20 pips in the right direction. Ichimoku indicator lines may move during the day, which should be taken into account when determining trading signals. In addition, the chart does illustrate support and resistance levels, which could be used to lock in profits. There are no important events scheduled for Friday in the UK, while the US will release reports on the PCE Price Index, Durable Goods Orders, and Capital Goods Orders. Considering that the pound is falling now, these reports can be used to open new shorts. In other words, there might be a reaction.
Price levels of support and resistance are thick red lines, near which the movement may end. They do not provide trading signals.
The Kijun-sen and Senkou Span B lines are the lines of the Ichimoku indicator, moved to the one-hour chart from the 4-hour one. They are strong lines.
Extreme levels are thin red lines from which the price bounced earlier. They provide trading signals.
Yellow lines are trend lines, trend channels, and any other technical patterns.
Indicator 1 on the COT charts reflects the net position size of each category of traders.
Indicator 2 on the COT charts reflects the net position size for the non-commercial group.
Le recensioni analitiche di InstaForex ti renderanno pienamente consapevole delle tendenze del mercato! Essendo un cliente InstaForex, ti viene fornito un gran numero di servizi gratuiti per il trading efficiente.


