 Rimani
Condizioni di trading
Strumenti


The macroeconomic calendar was empty. No important reports were released in the EU, the United Kingdom, and the Unites States.
In this regard, investors and traders focused on the incoming information and news flow. Several Federal Reserve officials made a speech, who once again conveyed the thoughts already known to everyone regarding the position of the regulator. This refers to the words that the labor market is strong, interest rates will continue to rise, and inflation may linger at a high level for some time.
In fact, the market once again received a hawkish message from the Fed, but did not pay attention to it.
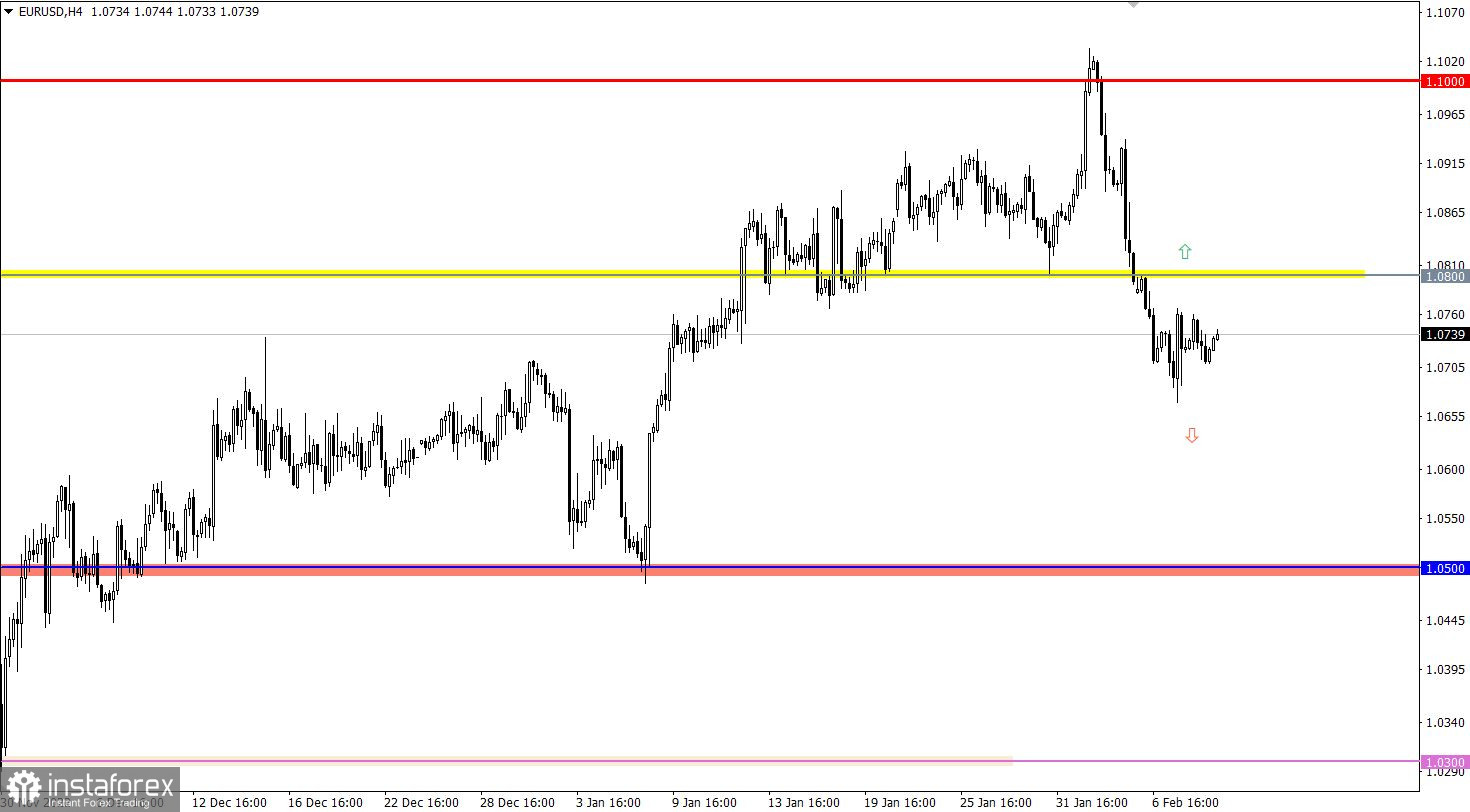
The EURUSD currency pair is in conditional stagnation for the second day, with a fluctuation amplitude of about 90 points. This lateral move indicates a process of accumulation of trading forces, in which an increase in activity is possible at the time of its completion.
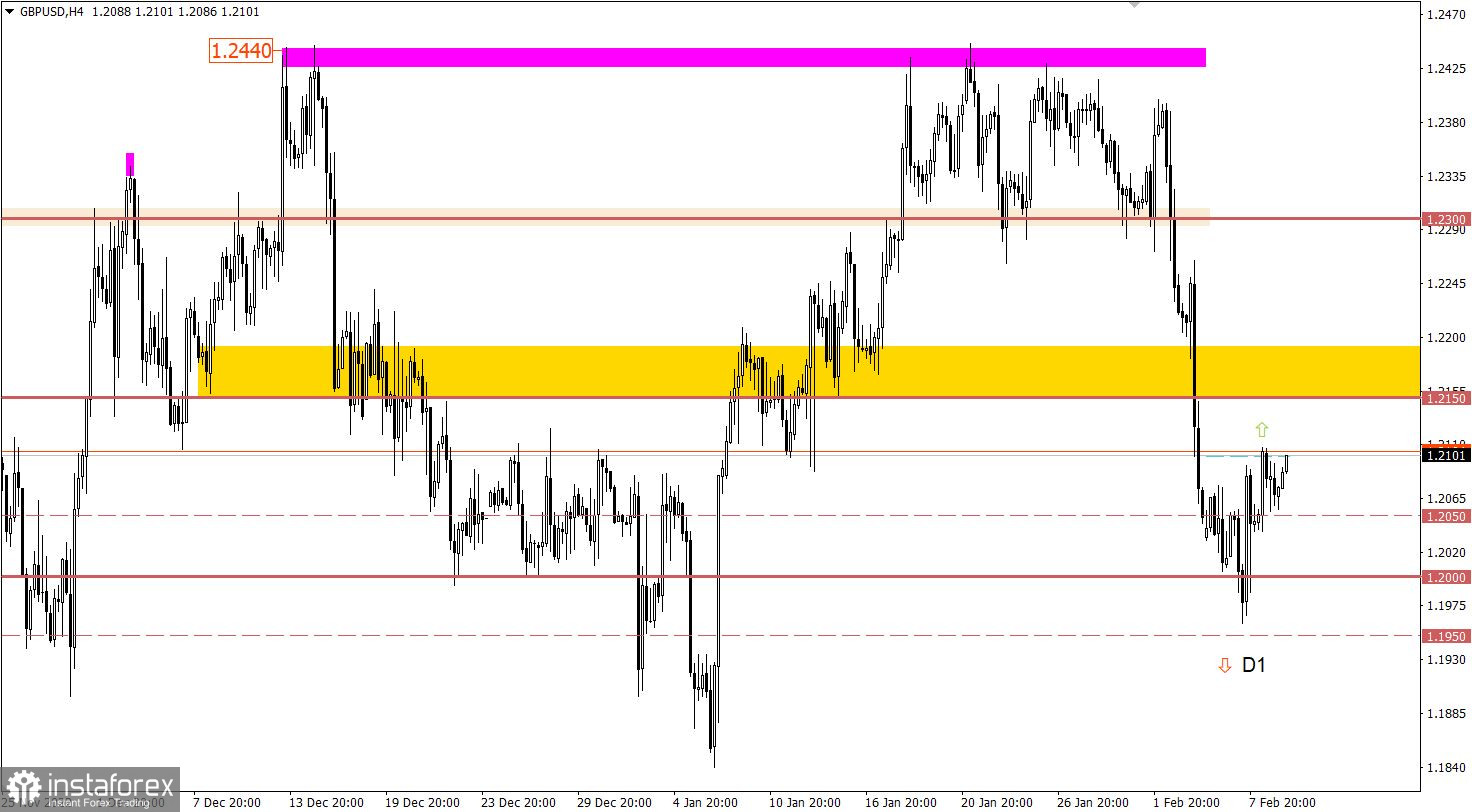
The GBPUSD currency pair has slowed down the corrective move from the high of the upward trend in the area of the 1.2000 psychological level. As a result, there was a pullback in the market, which led to a gradual increase in long positions in the pound sterling.

Weekly jobless claims data in the United States is expected to be released today, with the overall rate forecast to rise. This is a negative factor for the labor market.
Statistics details:
The volume of continuing claims for benefits may rise from 1.655 million to 1.658 million.
The volume of initial claims for benefits may rise from 183,000 to 190,000.
Time targeting:
U.S. Jobless Claims – 13:30 UTC
In this situation, the amplitude sideways move focuses the abundant attention of speculators on itself. As a result, an outgoing impulse may appear, based on which a technical signal will arise about the completion of the flat and the transition to the stage of a new cycle.
We concretize the above:
The downward cycle will be relevant if the price holds below the level of 1.0660 in a four-hour period. This step may lead to the prolongation of the current corrective move.
The upward cycle for the currency pair is taken into account in case of a stable holding of the price above the value of 1.0800 in a four-hour period. This step will indicate the completion of the corrective move.
In this situation, a stable holding of the price above 1.2100 may eventually lead to a gradual recovery in the value of the British currency. While the return of the price below 1.2050 may eventually lead to an update of the local low of the correction.
The candlestick chart type is white and black graphic rectangles with lines above and below. With a detailed analysis of each individual candle, you can see its characteristics relative to a particular time frame: opening price, closing price, intraday high and low.
Horizontal levels are price coordinates, relative to which a price may stop or reverse its trajectory. In the market, these levels are called support and resistance.
Circles and rectangles are highlighted examples where the price reversed in history. This color highlighting indicates horizontal lines that may put pressure on the asset's price in the future.
The up/down arrows are landmarks of the possible price direction in the future.
Le recensioni analitiche di InstaForex ti renderanno pienamente consapevole delle tendenze del mercato! Essendo un cliente InstaForex, ti viene fornito un gran numero di servizi gratuiti per il trading efficiente.

