 Rimani
Condizioni di trading
Strumenti


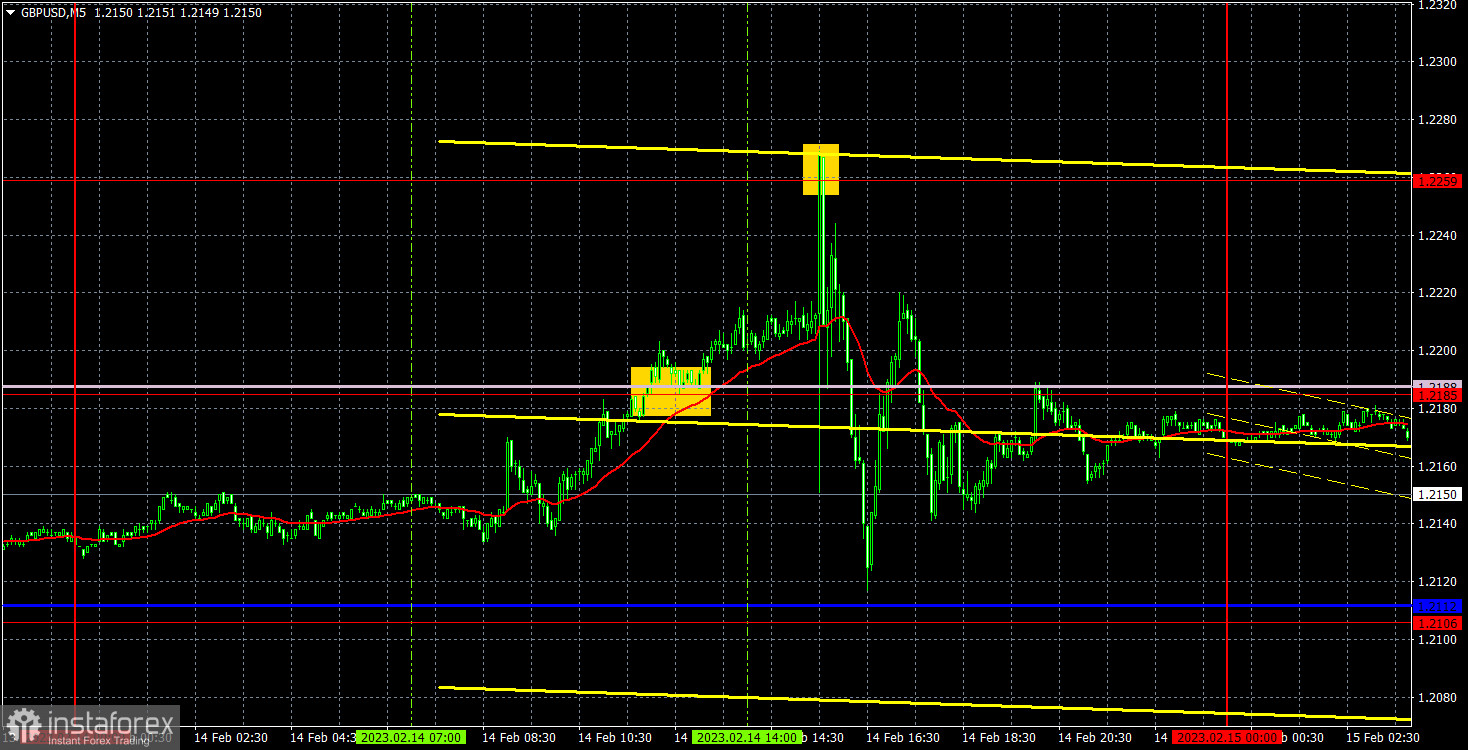
On Tuesday, GBP/USD traded in sync with EUR/USD. In the first half of the day, the pound sterling grew modestly. In the second half of the day, the instrument traded on a roller coaster. The currency pair made price wings of 150 pips within a couple of hours. In principle, traders responded strongly to the US CPI report, though the UK also presented some metrics. The UK reported on its unemployment rate and wages, but they were reports of secondary importance. So, traders could hardly decide to react to this data. After the publication of the US CPI, the currency pair was gyrating in both directions. Eventually, the US dollar advanced across the board in a logical move. Indeed, inflation in the US eased its pace marginally. This is bad evidence for the Federal Reserve and bullish for the US dollar. From now on, the currency pair will logically try to retreat to the area below the critical level. The pound sterling hasn't been corrected in full yet. There are no fundamental factors for its growth. The UK inflation report will be on tap in an hour which could trigger high volatility in the currency market. We would rather wait for the UK CPI than look into the crystal ball.
The situation with trading signals for the sterling is the same as for the euro. During the European session, the instrument generated a signal when the price had surpassed the Senkou Span B line and the level of 1.2185. Before the inflation report, GBP/USD had climbed by 20-30 pips which could have been earned by traders if they had set a stop loss at break even or closed positions manually. In theory, traders could have earned on a drop off 1.2259, but it was difficult to open positions because the price slumped rapidly.
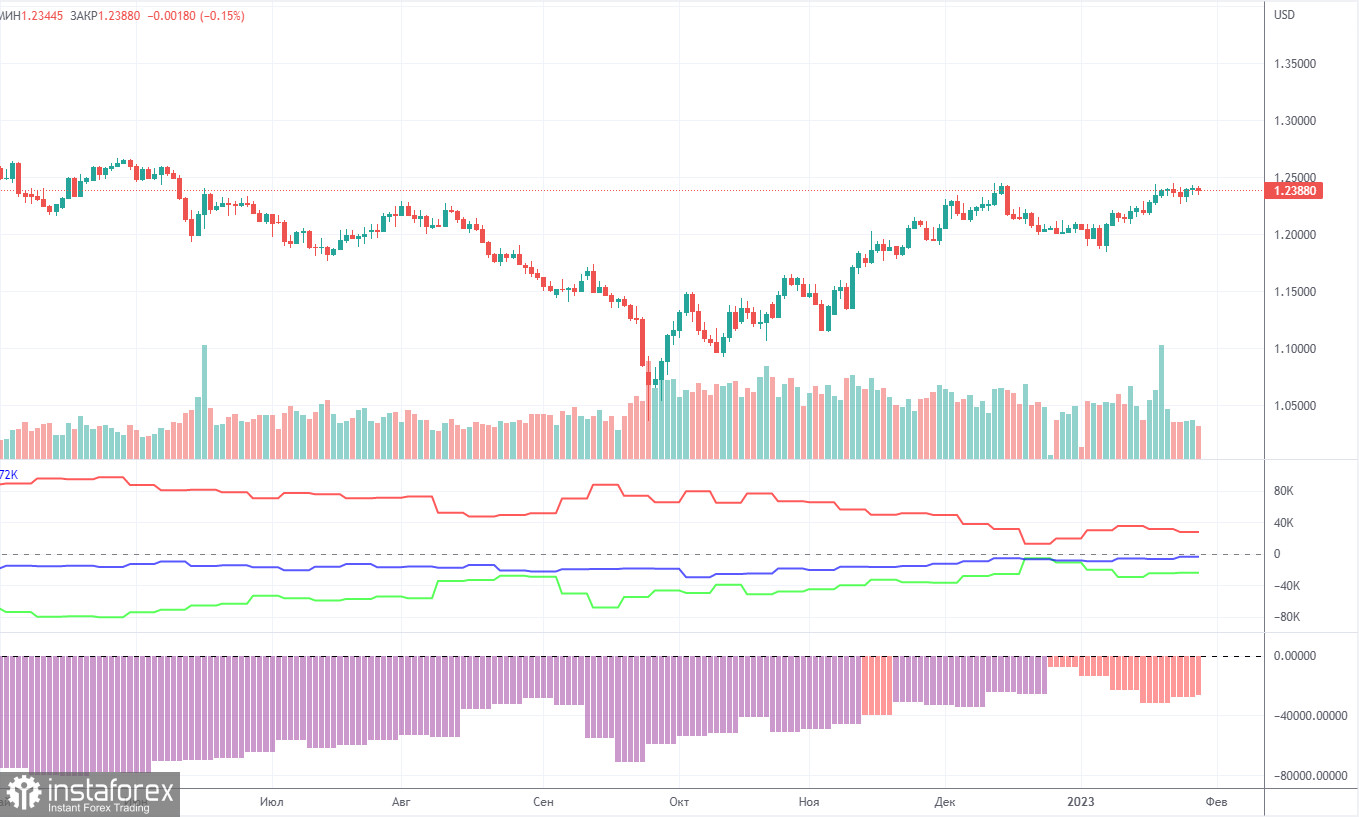
The latest COT report on GBP/USD showed that the bearish sentiment is getting weaker. Last week, the Non-commercial group closed 6.7K BUY contracts and 7.5K SELL contracts. Thus, the net position of non-commercial traders increased by 0.8K. The net position indicator has been growing steadily over the past months, and the sentiment of market makers may become bullish in the near future, but so far it has not. Although the pound sterling has risen against the dollar in recent months, it is very difficult to answer the question of why it has appreciated so much from a fundamental point of view.
We absolutely do not rule out the scenario that the pound will continue to fall in the near future and in the medium term as the market still needs a correction. In general, in recent months, COT reports correspond to the actual movement of the British currency, so there are no questions. Since the net position is not even "bullish" yet, traders could be interested to continue buying for several months, but they must adjust their trading decisions to weighty fundamentals which are not yet available. The Non-commercial group now has a total of 35,000 buy contracts and 59,000 sell contracts open.
We remain sceptical about the long-term growth of the British currency, although there are certain reasons for this. In fact, fundamentals or geopolitics clearly do not suggest such a strong and rapid rally of the pound sterling.
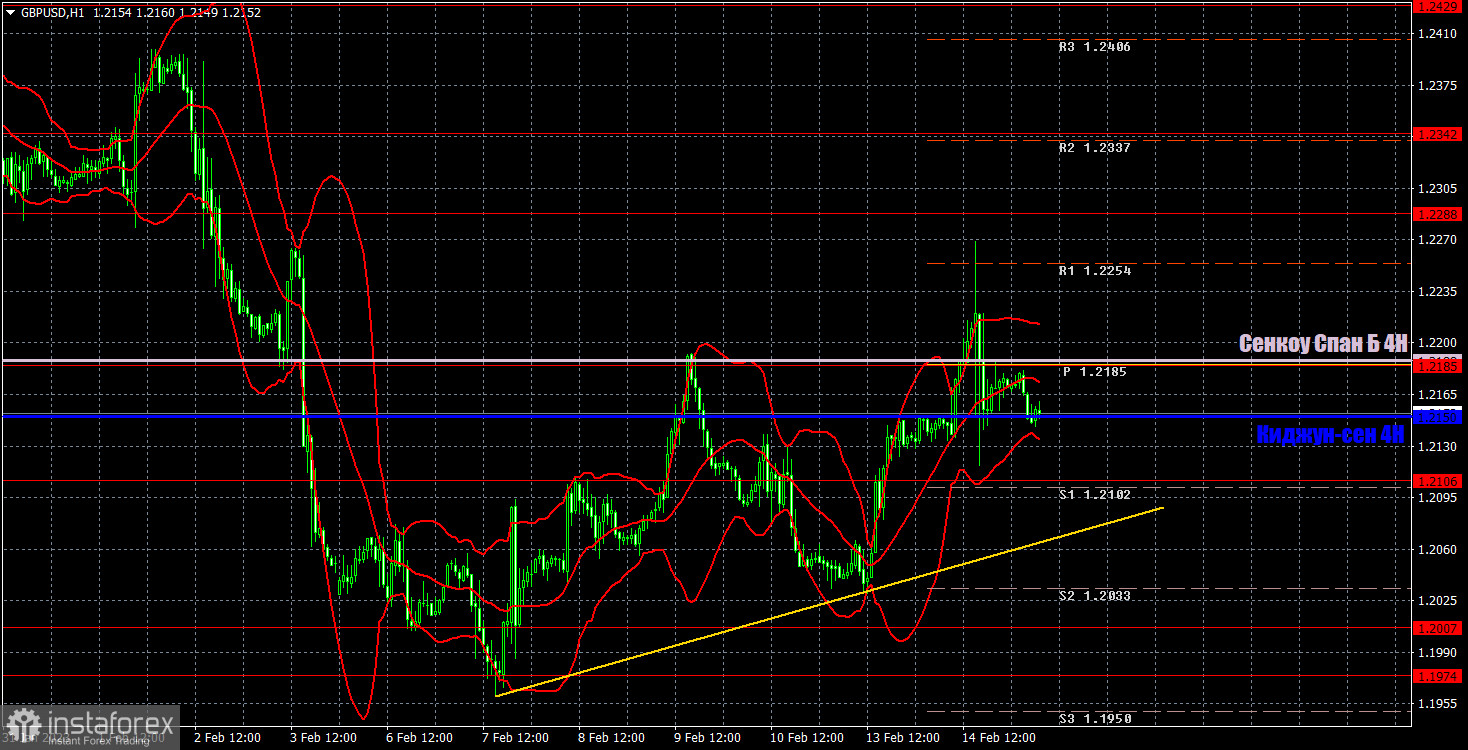
In the 1-hour timeframe, GBP/USD began a new upward leg. It is now trading at about the Senkou Span B line. A drop off this line is highly probable, but a modest uptrend has been going on. This is proven by the trend line. Nevertheless, we still expect GBP to resume its decline. On February 15, we determine the following key levels: 1.1760, 1.1874, 1.1974-1.2007, 1.2106, 1.2185, 1.2288, 1.2342, and 1.2429. The Senkou Span B (1.2188) and Kijun-sen (1.2150) can also provide trading signals. The signals could be generated after drops and bounces as well as after passing these levels and lines. It is recommended to set a stop loss at break even when the price moves 20 pips in the expected direction. The Ichimoku indicator's lines could shift intraday which should be allowed for when recognizing trading signals. The chart also includes support and resistance levels which could be used for profit-taking on your positions. On Wednesday, the UK is due to release a crucial inflation report which will set the tone for GBP/USD today. Later today, the US will report on its industrial production and retail sales. Beware of high volatility during the North American session.
Support and resistance levels are plotted by thick red lines, near which the movement may end. Commonly, they do not generate trading signals.
The Kijun-sen and Senkou Span B lines are the Ichimoku indicator lines transferred to the 1-hour timeframe from the 4-hour timeframe. They are strong lines.
Extreme levels are thin red lines, from which the price bounced or dropped earlier. They are sources of trading signals.
Yellow lines are trend lines, trend channels, and any other technical patterns.
Indicator 1 on the COT charts is the size of the net position of each category of traders.
Indicator 2 on the COT charts is the size of the net position for the Non-commercial group.
Le recensioni analitiche di InstaForex ti renderanno pienamente consapevole delle tendenze del mercato! Essendo un cliente InstaForex, ti viene fornito un gran numero di servizi gratuiti per il trading efficiente.

