 Rimani
Condizioni di trading
Strumenti


Analysis of the 5M timeframe (GBP/USD).
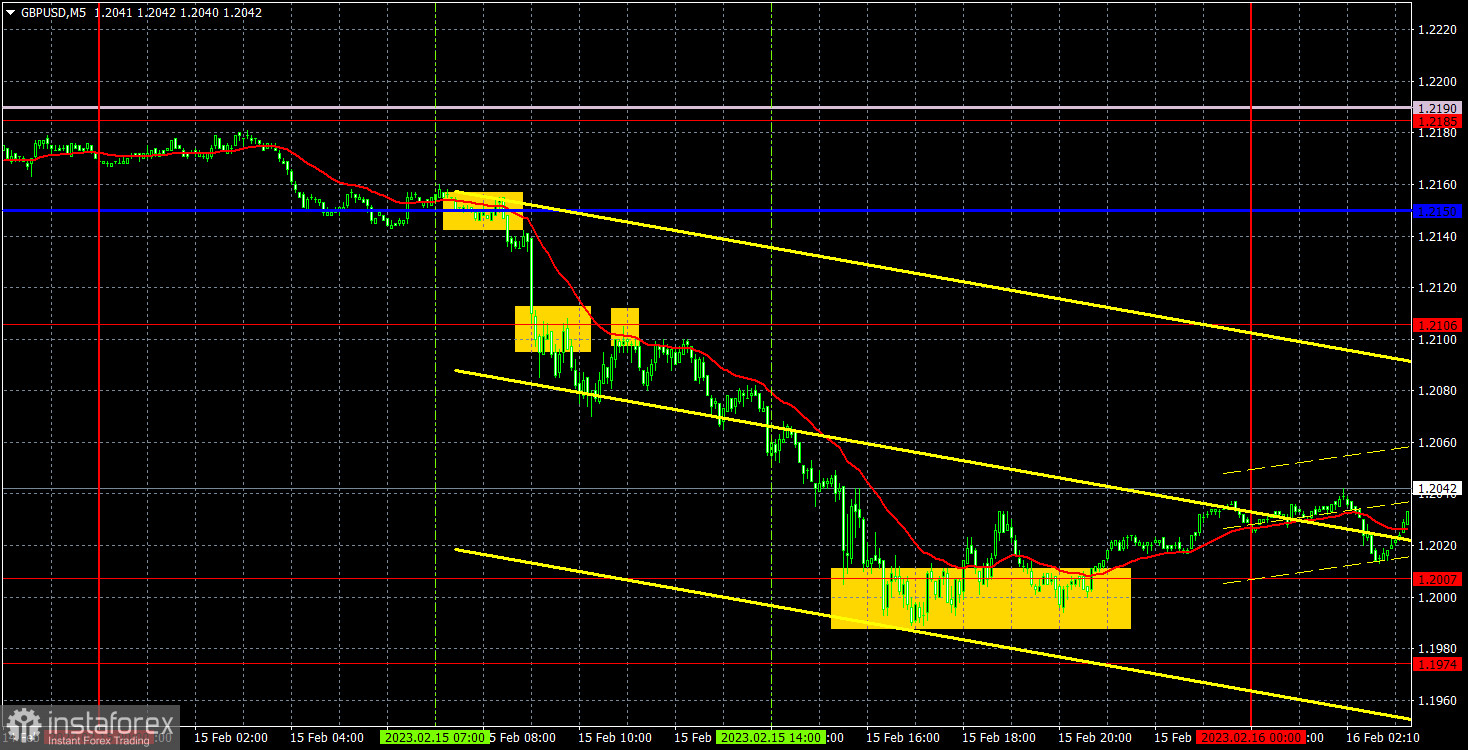
On Wednesday, the GBP/USD currency pair decreased by 150 points. The UK inflation data, which naturally was the only event that caused the decline in quotes, was released early in the morning. As of Wednesday morning, the report on US inflation, which should have caused the US dollar to increase, has not yet been properly received by the market. All became evident after the British inflation data was released. The pound is anticipated to decline at virtually any value of this report, as we have already stated in our fundamental articles. First of all, it hasn't yet been adjusted completely. Second, since inflation is already out of control, there is now no correlation between it and the Bank of England's interest rates. As a result, the consumer price index decreased to 10.1%, which has no bearing on potential changes in monetary policy in the future. The only remaining concern is whether BA will be able to raise the rate by as much as is necessary to reach the target. The British regulator still has to increase the key rate at the fastest possible rate.
Even before the report was released and right at the start of the European session, the first trading signal was established. Traders were able to open a short position after the price bounced off the pivotal line. Before the report, a stop loss could be set at breakeven or a minor loss because the likelihood of a collapse, in any event, was high. The same fall then started and finished solely in the range of 1.1974 to 1.2007. The short positions ought to have been closed using the subsequent recovery (a buy signal) from this level. About 120 points were made in profit. Another option was to try to develop a buy signal, however, this did not result in any gain or loss.
The "bearish" sentiment appeared to be decreasing in the most recent COT report on the British pound. The non-commercial group closed 7,500 sell contracts and 6,700 buy contracts throughout the week. As a result, non-commercial traders' net position increased by 0.8 thousand. The net position indicator has been slowly rising over the past few months, and although it hasn't yet, it suggests that significant players' attitudes may soon turn "bullish." Although the value of the pound against the dollar has increased recently, it is quite challenging to identify the basic reasons behind this growth. While there is still a need for adjustment, we cannot rule out the possibility that the pound may continue to decline in the near (or medium) term. There are no questions because COT reports have generally matched the trend of the pound sterling in recent months. Purchases may continue in the future for a few months, but they must have the right "base" underneath them, which they do not now have because the net position is not even "bullish" yet. A total of 35,000 contracts for purchases and 59,000 contracts for sales have now been opened by the non-commercial group. Although there are some reasons to believe that the British currency would increase over the long term, geopolitics does not support such a significant and quick pound strengthening.
Analysis of the 1H timeframe (GBP/USD).
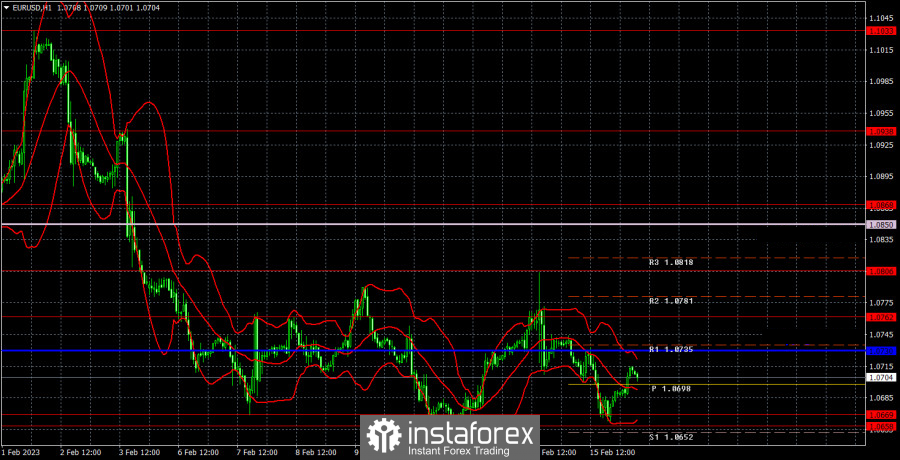
The upward trend line shows that the pound/dollar pair began a new cycle of upward movement on the hourly timeframe and completed it quite swiftly. The price was unable to go below the range of 1.1974 and 1.2007, nevertheless. As a result, an upward rebound is currently feasible, but generally speaking, we think that the pound will continue to decline for some time. On February 16, we emphasize these crucial levels: 1.1760, 1.1874, 1.1974-1.2007, 1.2106, 1.2185, 1.2288, 1.2342, 1.2429. Signal sources can also include the Senkou Span B (1.2180) and Kijun-sen (1.2128) lines. These levels and lines can be "bounced" and "surmounted" by signals. It is advised to set the stop loss level to breakeven when the price has moved 20 points in the desired direction. The Ichimoku indicator's lines might move during the day, therefore this should be considered while choosing trade signals. Support and resistance levels that can be used to determine transaction profit margins are also shown in the graphic. There are no macroeconomic events scheduled for Thursday in the UK, but three more or less important reports will be revealed in the US: the number of construction permits issued, the producer price index, and applications for unemployment benefits. We do not anticipate a significant response to this data.
Explanations for the illustrations:
Thick red lines represent price levels of support and resistance (resistance/support), where the movement may stop. They don't provide trading signals, though.
The Ichimoku indicator's Kijun-sen and Senkou Span B lines have been moved from the 4-hour timeframe to the hourly one.
The price previously bounced off of the tiny red lines that represent extreme levels. They provide signals for trading.
Trend lines, trend channels, and other technical patterns are represented by yellow lines.
The net position size of each trading category is represented by indicator 1 on the COT charts.
The net position size for the "Non-commercial" category is shown by indicator 2 on the COT charts.
Le recensioni analitiche di InstaForex ti renderanno pienamente consapevole delle tendenze del mercato! Essendo un cliente InstaForex, ti viene fornito un gran numero di servizi gratuiti per il trading efficiente.


