 Rimani
Condizioni di trading
Strumenti


EUR/USD continued to trade the same way it did a few days before. A rather weak downward movement, which is completely justified and expected. I have already mentioned that I expect the euro to continue to fall, because the factors that have been pushing the pair up for several months have been worked off by the traders more than once. Now it needs a technical bearish correction, which is hardly over. Besides, the European Central Bank is not in a hurry to toughen its hawkish rhetoric, while the Federal Reserve gladly does. The problem of inflation is more acute for the ECB, not the Fed. Generally, I think that the pair's systematic decline will continue for some time to come.
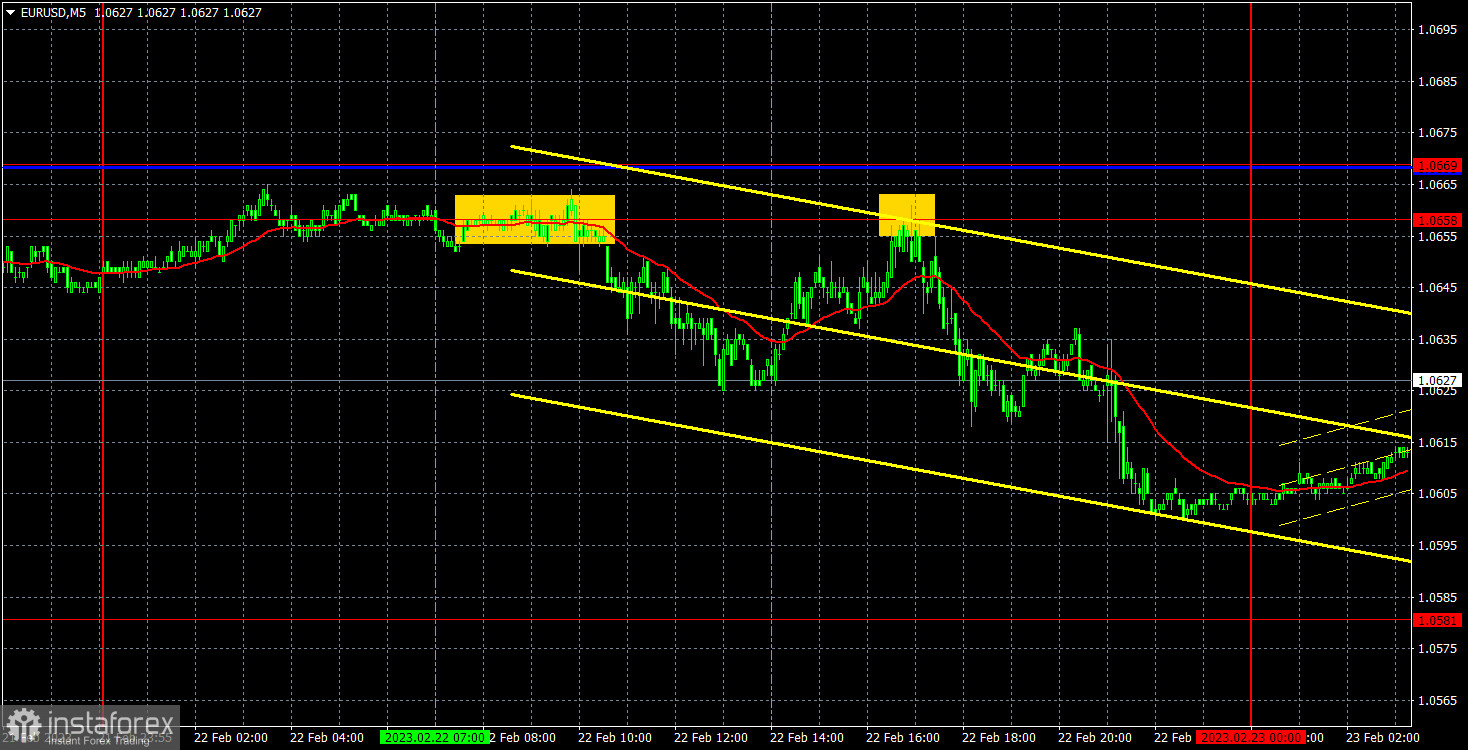
There were only two signals yesterday, and there were no important events during the day, except the Fed minutes. Therefore, all the reversals during the day were not related to fundamental events. The first rebound from 1.0658 triggered the 20 pips decline, which was enough only for the Stop Loss to Breakeven. The pair returned to 1.0658 and rebounded from this level again, which created the second sell signal. This time the price went down about 50 pips, but traders had to close the position earlier, closer to the evening and manually. Therefore, the profit was probably about 20 points.
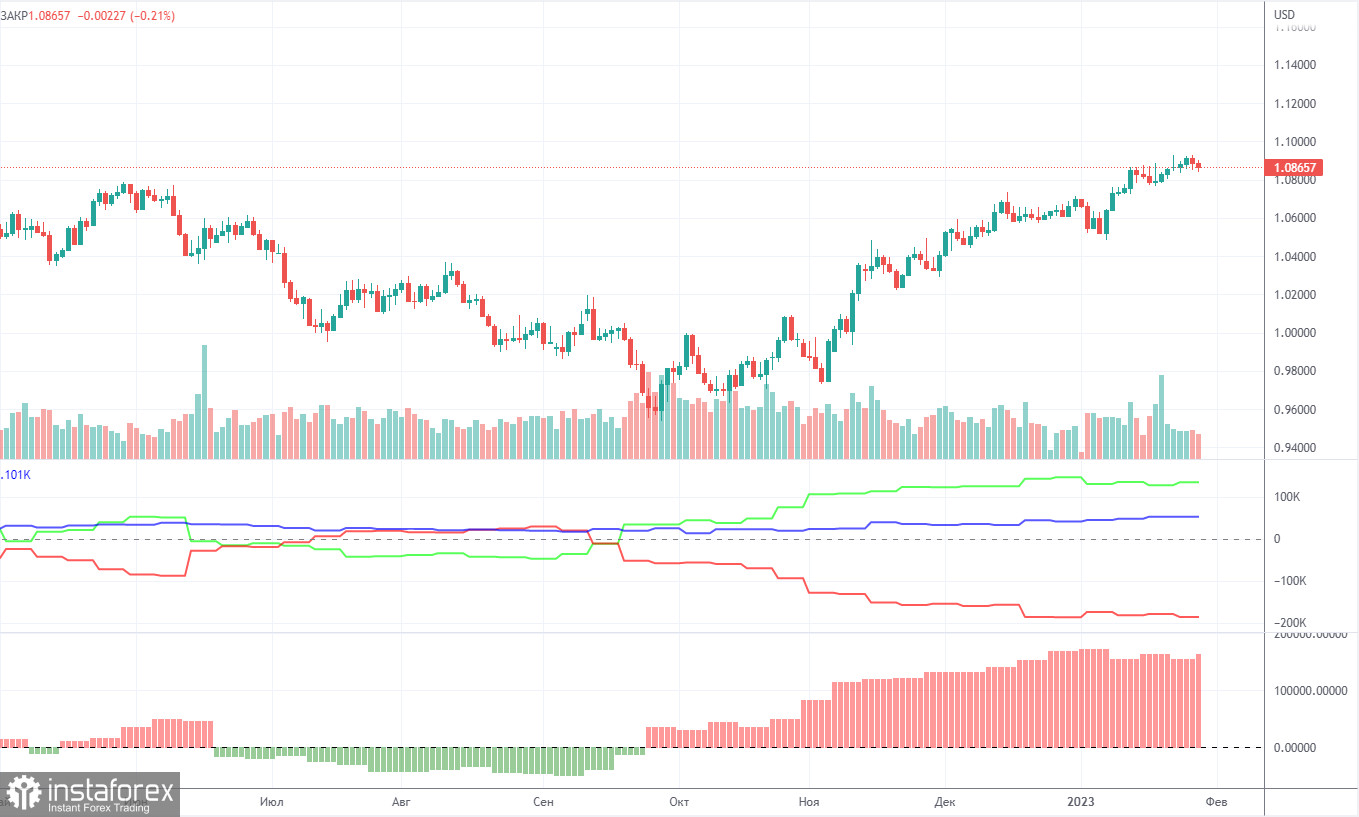
Due to a technical glitch, fresh COT reports have not been released since January 24. Therefore, we can only analyze reports published before this date. The COT reports on EUR/USD have been in line with expectations in recent months. The net non-commercial position has been on the rise since September. The bullish non-commercial position rises with each new week. Taking into account this fact, we may assume that the uptrend will soon come to an end. The red and green lines of the first indicator are far apart, which is usually a sign of the end of a trend. In the reporting week, non-commercial traders opened 9,500 long positions and 2,000 short ones. The net non-commercial position grew by 7,500. The number of long positions exceeds that of short ones by 134,000. In any case, a correction has been looming for a long time. Therefore, even without reports, it is clear that the downtrend will continue.
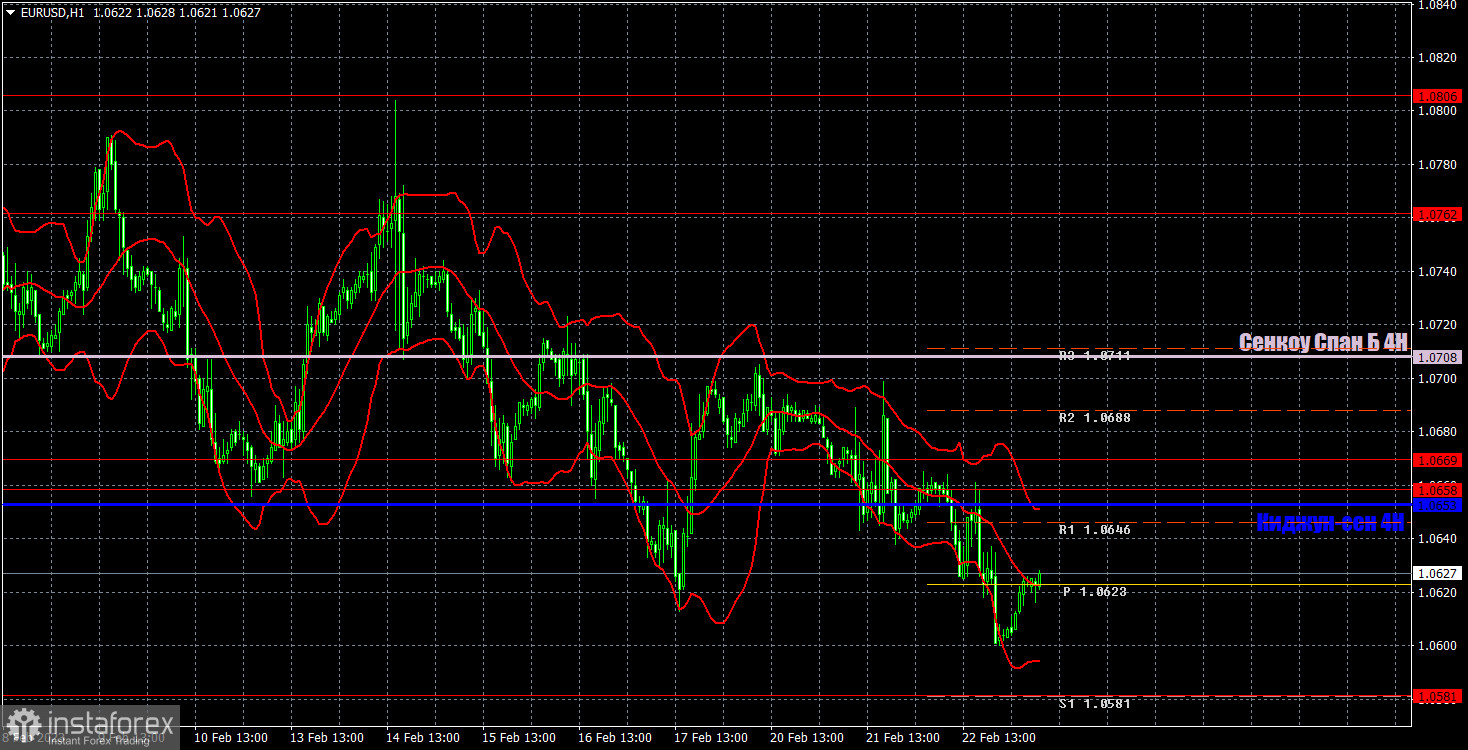
EUR/USD is still bearish and trades below the Ichimoku indicator lines. The downward movement is not strong, but at the same time it is stable. The movement is weak since there's almost no important market events right now, so the pair is moving according to our forecasts, but it's still too slow. But such movement is still better than a flat. On Thursday, important levels are seen at 1.0340-1.0366, 1.0485, 1.0581, 1.0658-1.0669, 1.0762, and also Senkou Span B lines (1.0708) and Kijun Sen (1.0653). Ichimoku indicator lines can move intraday, which should be taken into account when determining trading signals. There are also support and resistance although no signals are made near these levels. They could be made when the price either breaks or rebounds from these extreme levels. Do not forget to place Stop Loss at the breakeven point when the price goes by 15 pips in the right direction. In case of a false breakout, it could save you from possible losses. On February 23, the EU will release its second estimate of inflation for January. It is unlikely to differ much from the first, so I don't expect the market to react to this report. In the U.S. the GDP report for the fourth quarter will be published in the second estimate, so I don't expect the market to react to this report either. All other events of the day will be even less important than those listed above.
Resistance/support - thick red lines, near which the trend may stop. They do not make trading signals.
Kijun-sen and Senkou Span B are the Ichimoku indicator lines moved to the hourly timeframe from the 4-hour timeframe. They are also strong lines.
Extreme levels are thin red lines, from which the price used to bounce earlier. They can produce trading signals.
Yellow lines are trend lines, trend channels, and any other technical patterns.
Indicator 1 on the COT chart is the size of the net position of each trader category.
Indicator 2 on the COT chart is the size of the net position for the Non-commercial group of traders.
Le recensioni analitiche di InstaForex ti renderanno pienamente consapevole delle tendenze del mercato! Essendo un cliente InstaForex, ti viene fornito un gran numero di servizi gratuiti per il trading efficiente.

