 Rimani
Condizioni di trading
Strumenti


On Monday, GBP/USD also traded higher for most of the day. And for exactly the same reasons as EUR/USD. So let's just say that the pound is now openly enjoying a favorable moment, but the fundamental situation has not changed. It is still trading inside the horizontal channel at the 24-hour chart and the current growth is just the pair turning inside this channel. Of course, on the lower charts, these movements look like independent and good trends, but even according to the trend lines you can see how often the trends on the hourly chart change. That is why I believe it will stop rising. But when making trading decisions, we need to rely on specific signals, rather than speculation and conjecture.
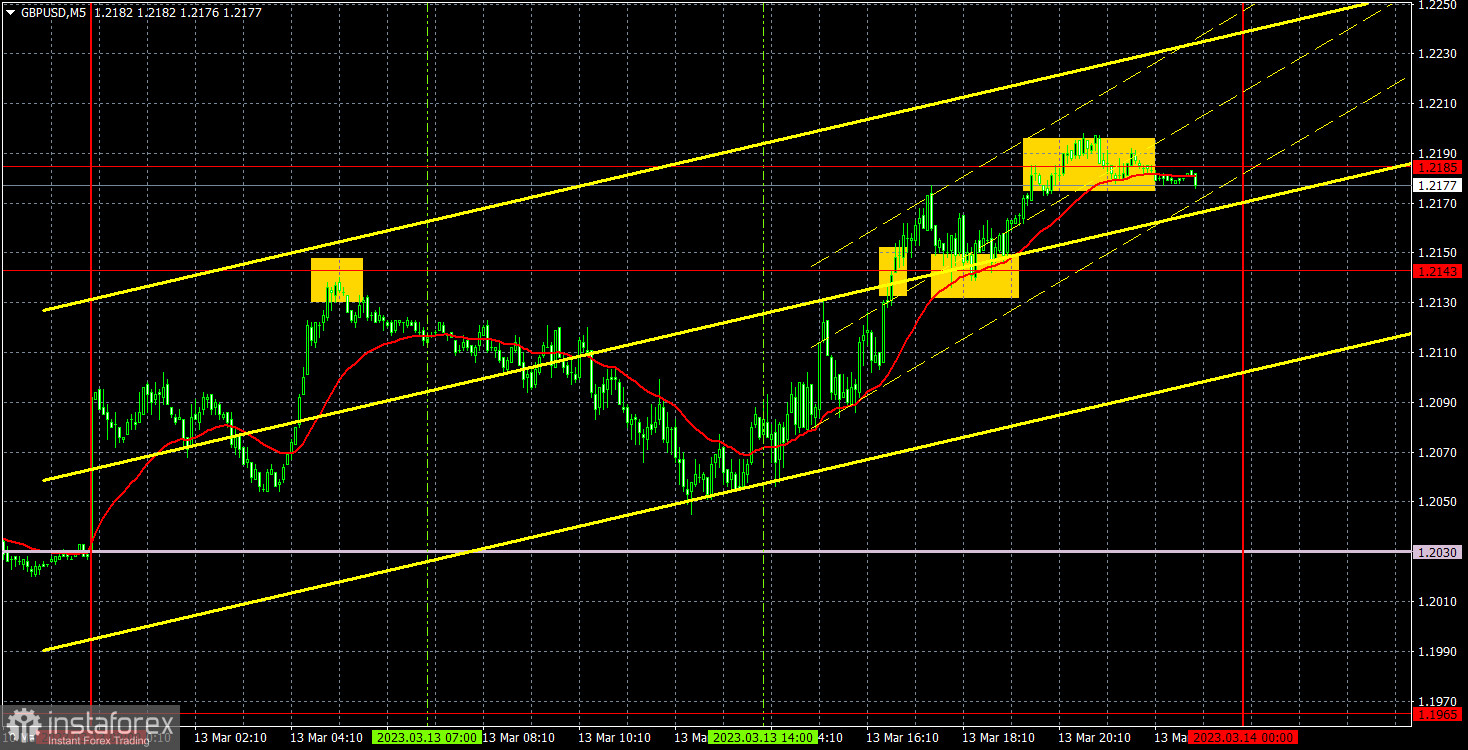
Speaking of trading signals, they were quite difficult. The first good sell signal was formed at night, and by the opening of the European session, the price was not far from the point of formation. Therefore, you could open a short position. Though, the pair failed to reach the nearest target level (only 15 pips), so it's unlikely that traders gained profit on that trade. Then the price settled above 1.2143, but rose only to 1.2185. And it happened in the evening. If traders opened a long position here, they could earn literally 20 pips.

The latest COT report on GBP/USD dates back to February 21. Naturally, these reports are of little use now, but it's still better than nothing at all. According to the latest data, non-commercial traders opened 3,300 long positions and 4,900 short ones. The net position fell by 1,600. The net non-commercial position has been bullish in recent months although sentiment remains bearish. The pound has been on the rise against the greenback for some unknown reason. We should not rule out the possibility of a strong decline in price in the near term. Technically, it has already started to decline although it seems to be a flat trend. In fact, the movement of GBP/USD is now akin to that of EUR/USD. At the same time, the net position on EUR/USD is positive, signaling the upcoming end of the bullish momentum. Meanwhile, the net position on GBP/USD is negative. Non-commercial traders now hold 67,000 sell positions and 46,000 long positions. There is still a gap. We are still skeptical that the pair will be bullish in the long term and expect a steep drop.

On the one-hour chart, GBP/USD has overcome another short-term trend line, which only confirms my assumptions about the "swing". Formally, the pair might continue rising for some time, but all the factors for growth should have already been worked off by the market. Swings persist, so the pair could fall this week. Although much will depend on today's U.S. inflation report. On March 14, it is recommended to trade at the key level of 1.1760, 1.1874, 1.1927, 1.1965, 1.2143, 1.2185, 1.2269, 1.2342, 1.2429. The Senkou Span B (1.1972) and Kijun Sen (1.1997) lines can also generate signals. Rebounds and breakouts from these lines can also serve as trading signals. It is better to set the Stop Loss at breakeven as soon as the price moves by 20 pips in the right direction. The lines of the Ichimoku indicator can change their position throughout the day which is worth keeping in mind when looking for trading signals. On the chart, you can also see support and resistance levels where you can take profit. On Tuesday, the UK will release data on unemployment, jobless claims and wages. It is not the most important data but it might provoke some reaction as well. The main event of the day will be the U.S. inflation report. A result closer to forecasts might cause a weak reaction, but a sharp deviation might set off a new storm in the market.
Resistance/support - thick red lines, near which the trend may stop. They do not make trading signals.
Kijun-sen and Senkou Span B are the Ichimoku indicator lines moved to the hourly timeframe from the 4-hour timeframe. They are also strong lines.
Extreme levels are thin red lines, from which the price used to bounce earlier. They can produce trading signals.
Yellow lines are trend lines, trend channels, and any other technical patterns.
Indicator 1 on the COT chart is the size of the net position of each trader category.
Indicator 2 on the COT chart is the size of the net position for the Non-commercial group of traders.
Le recensioni analitiche di InstaForex ti renderanno pienamente consapevole delle tendenze del mercato! Essendo un cliente InstaForex, ti viene fornito un gran numero di servizi gratuiti per il trading efficiente.

