 Rimani
Condizioni di trading
Strumenti


The volume of orders for durable goods in the U.S. is above forecast, but the market was influenced by an interview with ECB Executive Board member Philip Lane. The statistics showed an increase in order volume by 3.2% year-on-year in March and 0.3% month-on-month. Nevertheless, the market did not pay due attention to this data. The main driver for the market was the interview in which Lane clearly stated further interest rate hikes. He said that the current data indicates the need to raise the rate at the next Governing Council meeting, which will take place on May 4. He also noted that analysis shows that keeping the deposit rate at the current level of 3% is not advisable.
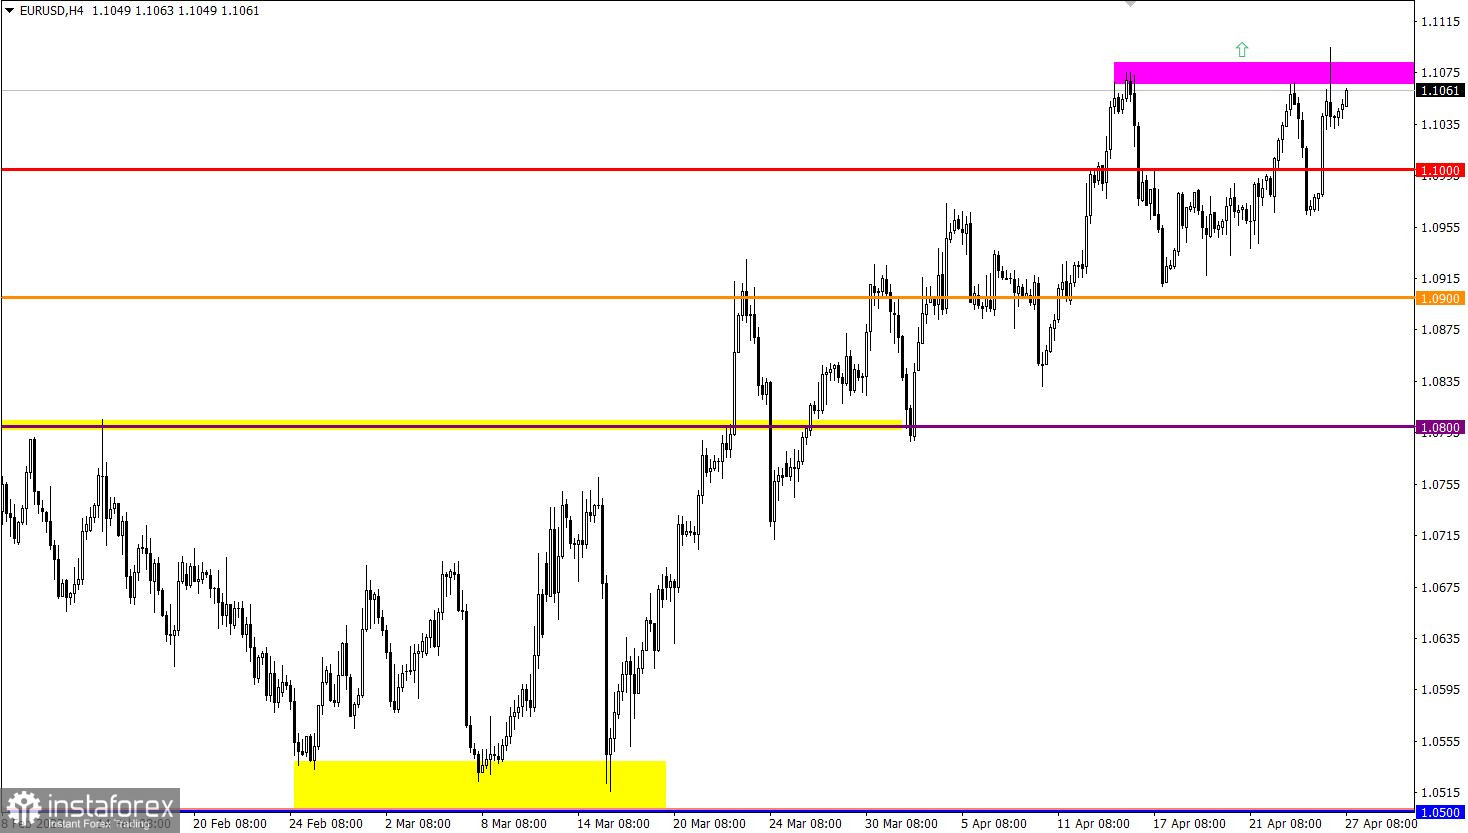
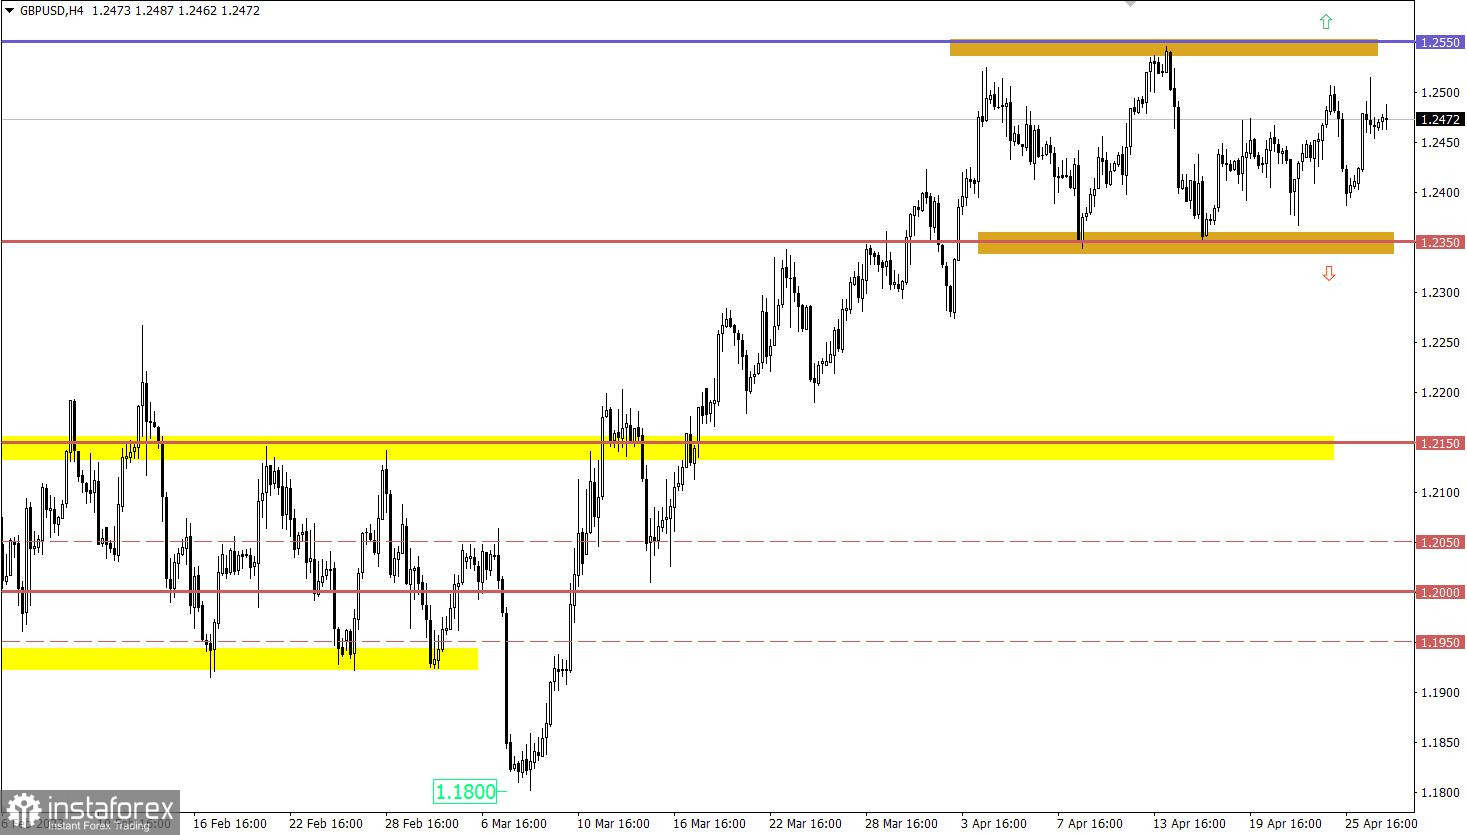
The EURUSD pair not only returned above the control level of 1.1000 but also updated the local high of the medium-term trend. This indicates a predominance of bullish sentiment among market participants, which, in the long term, may push the euro rate higher. On the other hand, the GBP/USD pair showed a local upward trend, but this movement did not lead to significant changes. The quote continues to move within the sideways channel 1.2350/1.2550 for the third week.

Today, the market may see a continuation of the euro's growth due to the first estimate of U.S. GDP for the first quarter, which may significantly slow down and indicate a sustainable slowdown in the economy and a possible slide into recession. This will undoubtedly affect the dollar's positions, negatively impacting them.
At the same time as the GDP data, indicators for unemployment benefit claims in the U.S. will be published, where their overall index is expected to grow. The details of the statistical data indicate that the volume of continuing claims for benefits may rise from 1.865 million to 1.878 million, and the volume of initial claims for benefits may rise from 245,000 to 248,000.
A rise in jobless claims is a negative factor for the labor market.
Time targeting:
U.S. Q1 GDP – 12:30 UTC
U.S. Jobless claims – 12:30 UTC
For the continuation of the upward cycle and the prolongation of the medium-term trend to new price levels, it is necessary for the euro rate to consistently stay above 1.1100, which would stimulate the growth of long positions volume. However, if the area of 1.1050/1.1100 puts pressure on buyers and leads to a decline in the rate, this may cause stagnation and even a reverse price rebound.
Since the currency pair continues to be in a sideways trend, traders continue to use two strategies: bounce and breakout relative to the established boundaries.
If we pay special attention to the breakout tactic, keeping the price above the 1.2550 level for a four-hour period will lead to a continuation of the medium-term upward trend. At the same time, keeping the price below the 1.2350 level may lead to the construction of a subsequent corrective movement.
The candlestick chart type is white and black graphic rectangles with lines above and below. With a detailed analysis of each individual candle, you can see its characteristics relative to a particular time frame: opening price, closing price, intraday high and low.
Horizontal levels are price coordinates, relative to which a price may stop or reverse its trajectory. In the market, these levels are called support and resistance.
Circles and rectangles are highlighted examples where the price reversed in history. This color highlighting indicates horizontal lines that may put pressure on the asset's price in the future.
The up/down arrows are landmarks of the possible price direction in the future.
Le recensioni analitiche di InstaForex ti renderanno pienamente consapevole delle tendenze del mercato! Essendo un cliente InstaForex, ti viene fornito un gran numero di servizi gratuiti per il trading efficiente.


