 Rimani
Condizioni di trading
Strumenti


On Friday, EUR/USD entered a sluggish bullish correction. Volatility was low. Fed Chair Powell's speech was the only interesting event. He hinted that the rate hike in May could be the last one in the current tightening cycle. The regulator will likely pause hiking interest rates. More rate increases may come if inflation stops declining or accelerates again and as early as the second half of the year. The greenback lost about 50 pips.
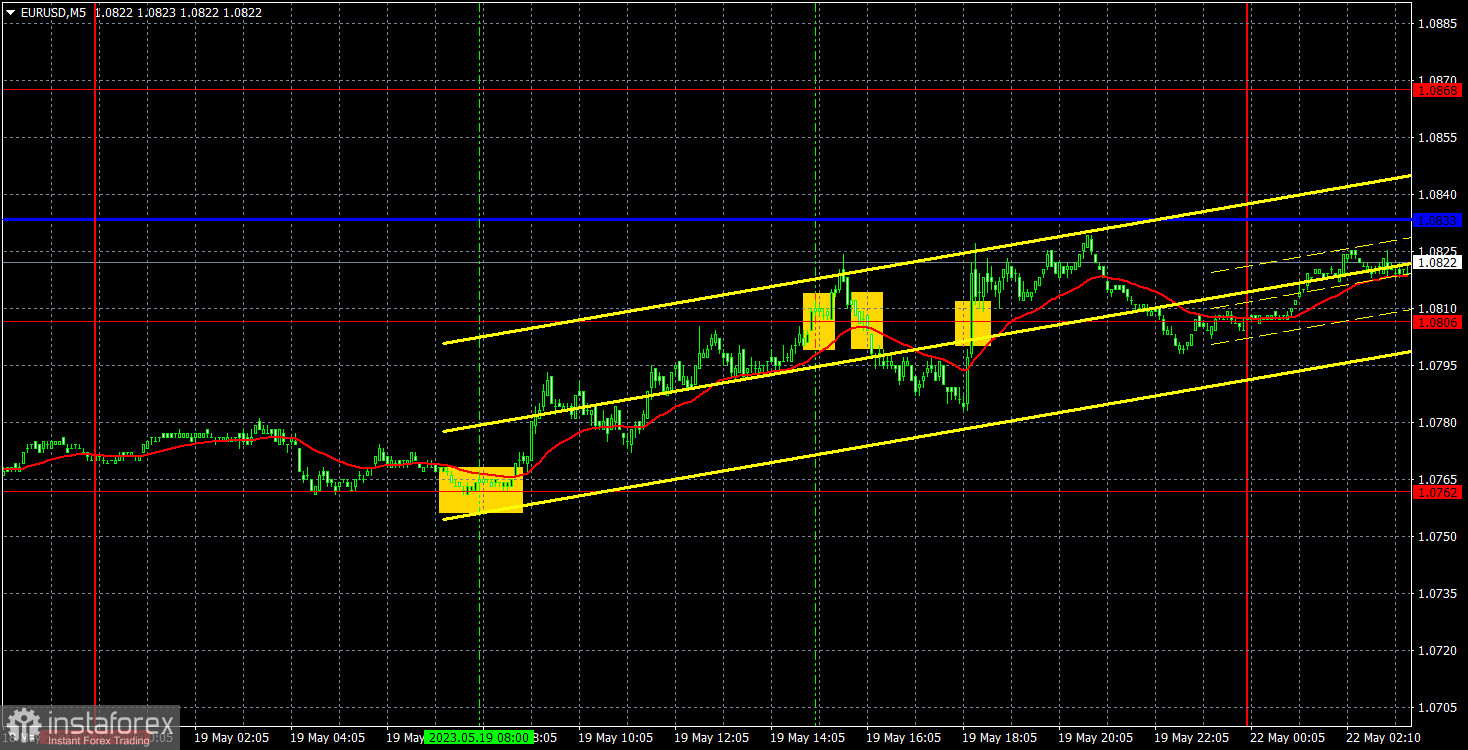
At the same time, several trading signals came. The price bounced to the critical line from 1.0762. After a sell signal at around 1.0806, it was time to close long positions, which brought 25 pips of profit. The signal that came ahead of Powell's speech generated a 10-pip profit. However, positions were closed manually. A buy signal that was produced when the Fed chair spoke should have been ignored.

The COT report for May 16 was delivered on Friday. Over the past 9 months, COT data has been in line with developments in the market. The net position (second indicator) has been on the rise since September 2022. The euro started to show strength approximately at the same time. Currently, the net non-commercial position is bullish and keeps growing further. Likewise, the euro is bullish.
Notably, we may assume by the extremely bullish net position that the uptrend may soon stop. The first indicator shows that, and the red and green lines are far away from each other, which is usually a sign that the end of the trend might be nearing. The euro attempted to go down several months ago, but those were just minor pullbacks. In the reporting week, long positions of non-commercial traders decreased by 1,600 and short positions dropped by 9,600. The net position rose by 8,000. The number of long positions exceeds that of short ones by 187,000, a rather big gap. A correction is still impending. So, it is clear that the pair may soon go down even without COT reports.
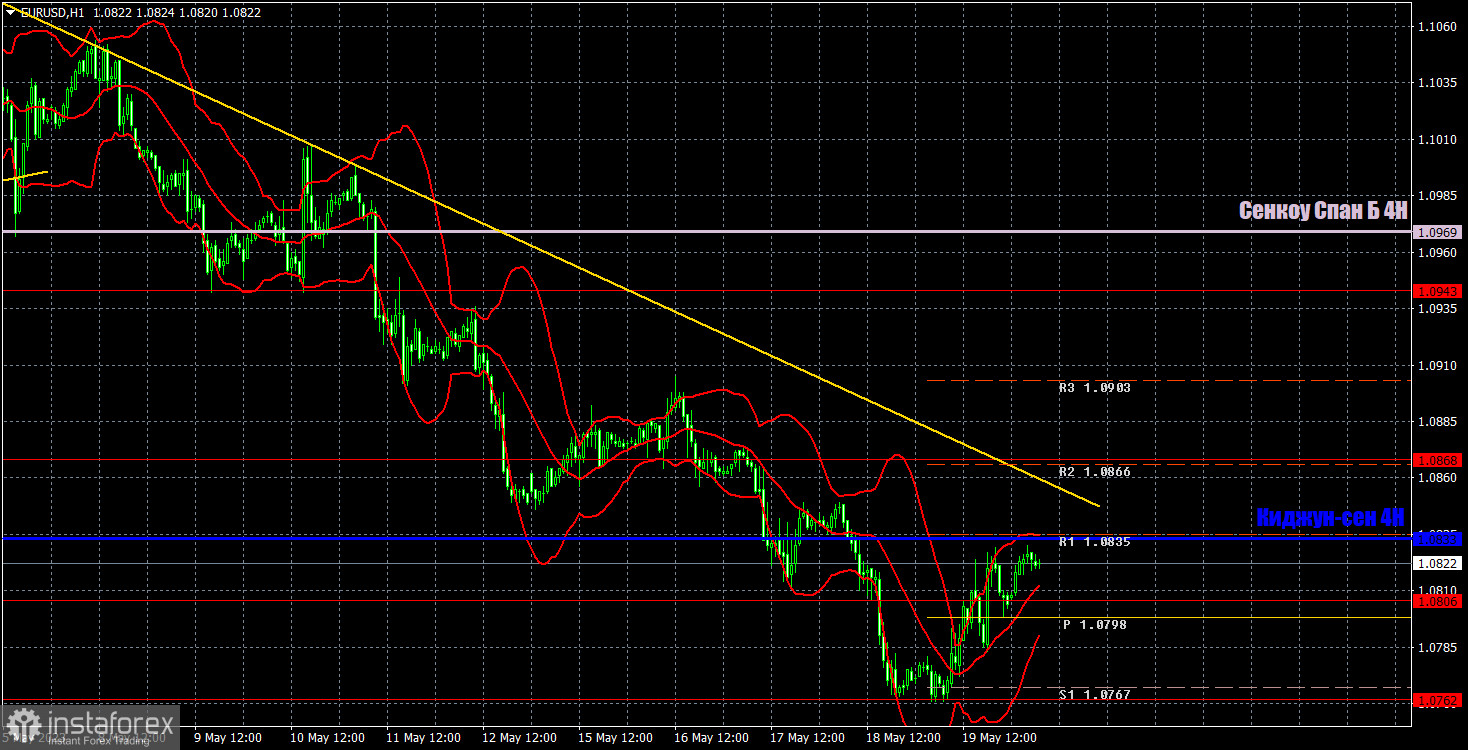
In the 1-hour time frame, the pair is moving down. The move is supported by the trendline. The greenback will likely keep strengthening against the euro because it is still oversold. All technical indicators signal a downtrend. Consolidation above the trendline and critical line may signal an uptrend. However, we still expect a fall in the medium term.
On May 22, trading levels are seen at 1.0581, 1.0658-1.0669, 1.0762, 1.0806, 1.0868, 1.0943, 1.1092, 1.1137-1.1185, 1.0969 (Senkou Span B) and 1.0833 (Kijun-sen). Ichimoku indicator lines can move intraday, which should be taken into account when determining trading signals. There are also support and resistance although no signals are made near these levels. Signals could be made when the price either breaks or bounces from these extreme levels. Do not forget to place Stop Loss at the breakeven point when the price goes by 15 pips in the right direction. In case of a false breakout, it could save you from possible losses.
The macroeconomic calendar of the EU is empty today. In the US, some Fed officials will speak. The market will unlikely react to those speeches. All in all, Monday will likely be a calm and low-volatile trading day.
Indicators on charts:
Resistance/support - thick red lines, near which the trend may stop. They do not make trading signals.
Kijun-sen and Senkou Span B are the Ichimoku indicator lines moved to the hourly timeframe from the 4-hour timeframe. They are also strong lines.
Extreme levels are thin red lines, from which the price used to bounce earlier. They can produce trading signals.
Yellow lines are trend lines, trend channels, and other technical patterns.
Indicator 1 on the COT chart is the size of the net position of each trader category.
Indicator 2 on the COT chart is the size of the net position for the Non-commercial group of traders.
Le recensioni analitiche di InstaForex ti renderanno pienamente consapevole delle tendenze del mercato! Essendo un cliente InstaForex, ti viene fornito un gran numero di servizi gratuiti per il trading efficiente.

