 Rimani
Condizioni di trading
Strumenti


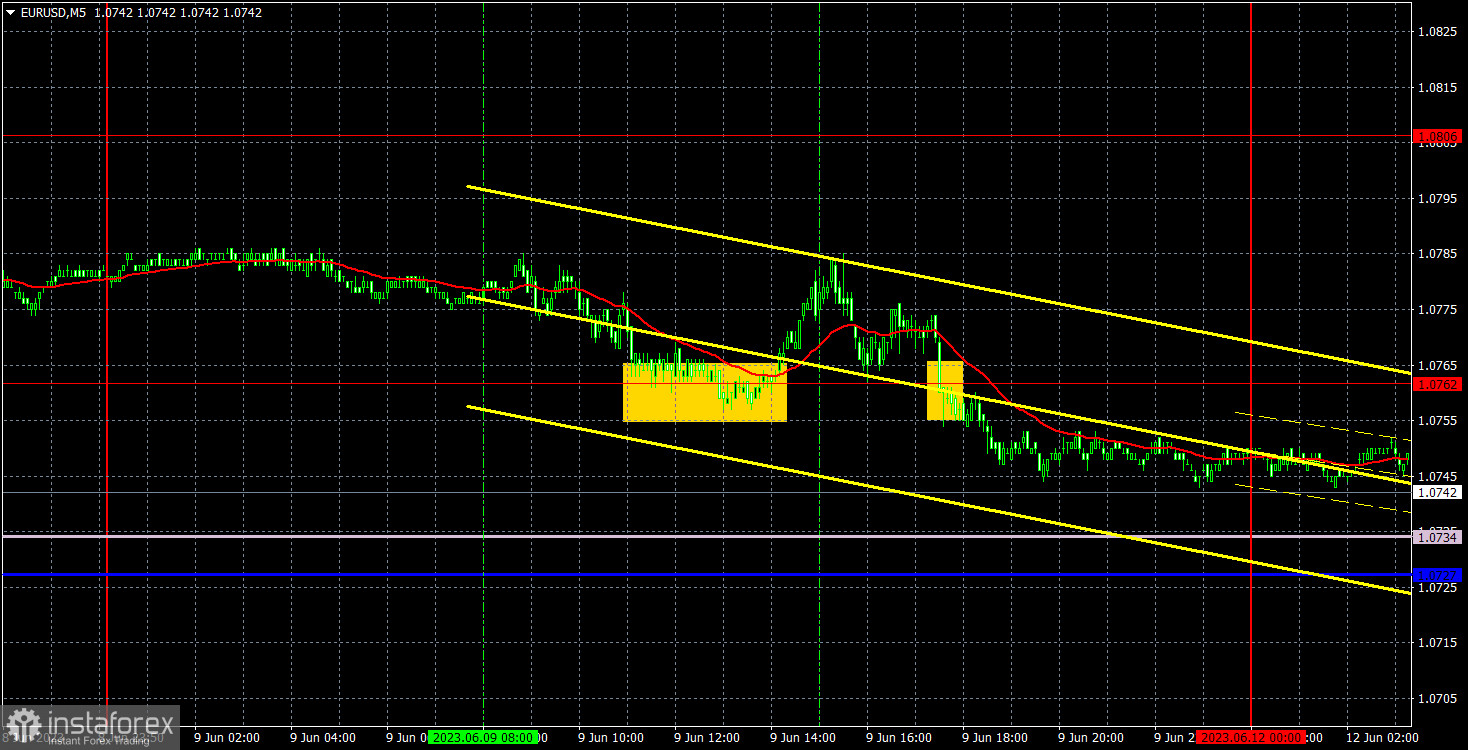
The movements of the EUR/USD pair were about 40 pips last Friday. During the day there were no important events or economic reports. Thus, there was nothing to analyze. The pair declined slightly. It still remains above the lines of the Ichimoku indicator. The upward trend persists. However, it is so weak that it may turn out to be a correction but not a new uptrend. Yet, investors are not expecting a new uptrend right now. The euro is still located at high levels. Its movements are more or less predictable, unlike the pound sterling. Therefore, the euro will hardly rise markedly this week even when the economic calendar is rich in events.
There were only two trading signals on Friday. The pair rebounded from the 1.0762 level but later dropped below this level. At first, the pair added 15 pips and after the fall, it brought 10 pips. For long positions, a Stop Loss order was activated at breakeven. For short positions, it was possible to get 10 pips of profit by closing the transaction manually.
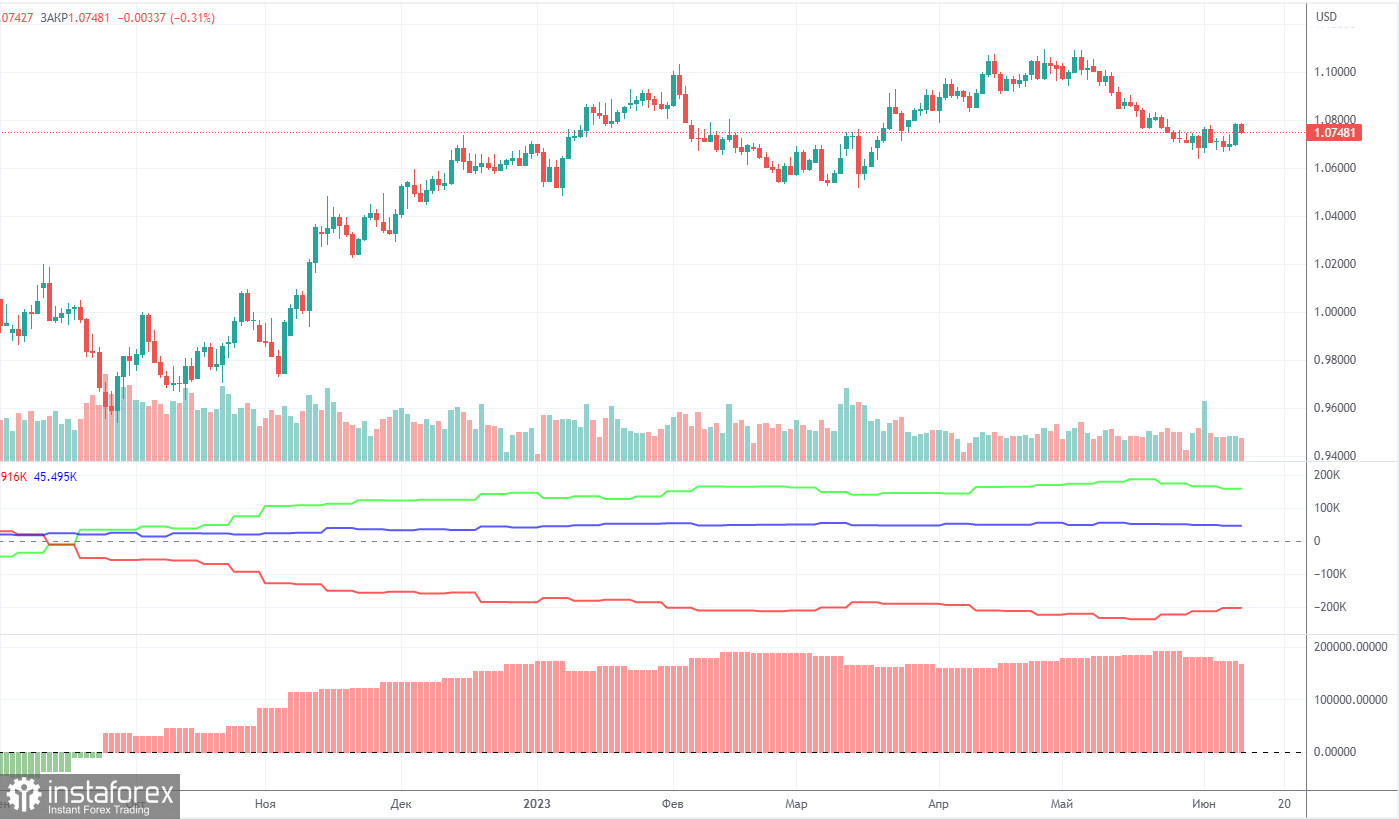
On Friday, a new COT report for June 6 was released. In the last 9 months, COT reports have fully corresponded to what is happening on the market. The chart above clearly shows that the net position of big traders (the second indicator) began to grow again in September 2022. At the same time, the euro resumed an upward movement. The net position of non-commercial traders is bullish. The euro is trading at its highs against the US dollar.
I have already mentioned that a fairly high value of the "net position" indicates the end of the uptrend. The first indicator also signals such a possibility as the red and green lines are very far from each other. It often occurs before the end of the trend. The euro tried to start falling a few months ago but there was only a pullback. During the last reporting week, the number of long positions of the "Non-commercial" group of traders decreased by 5,700 and the number of short positions rose by 1,500. The number of long positions is higher than the number of short ones. This is a very large gap. The number of long positions is 59,000 higher than short ones. The difference is more than three times. The correction has begun. Yet, it may not be a correction but the start of a new downtrend. At this time, it is clear that the pair is likely to resume a downward movement without COT reports.
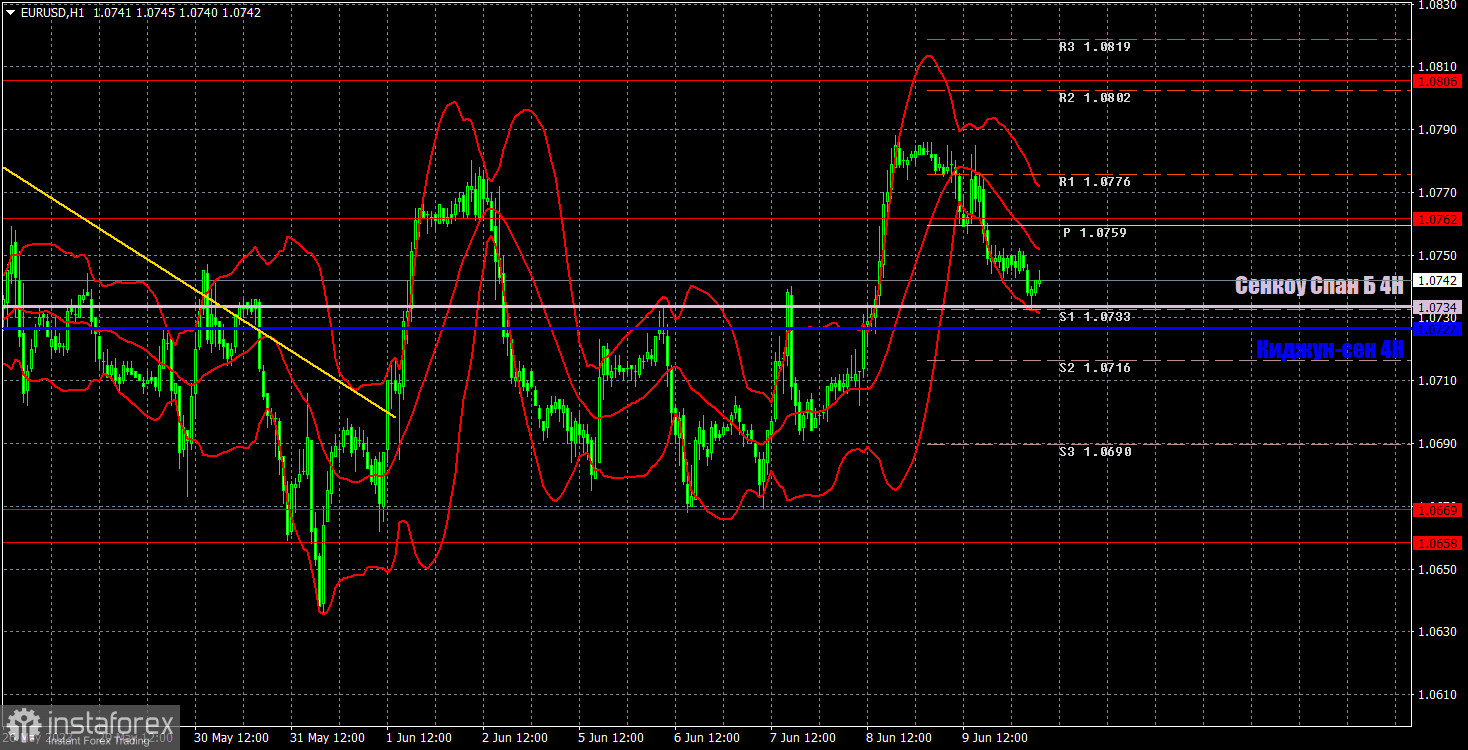
On the 1H, the pair is trying to start an upward correction but there are no drivers for growth. Therefore, the downtrend may resume in the near future. However, it could hardly happen this week as traders will have to digest the results of two meetings of central banks as well as Us inflation data. The movements could be strong and unpredictable. Yet, the medium-term outlook remains bearish.
On June 12, one should pay attention to the following levels: 1.0537, 1.0581, 1.0658-1.0669, 1.0762, 1.0806, 1.0868, 1.0943, 1.1092 as well as the Senkou Span B (1.0734) and Kijun-sen (1.0727) lines. The lines of the Ichimoku indicator can move during the day. Bear it in mind when determining trading signals. There are also support and resistance levels but they do not provide signals, e.g. bounces or breakouts from extreme levels and lines. Do not forget about placing a Stop Loss order at breakeven if the price moves in the right direction by 15 pips. It will you avoid losses if the signal turns out to be false.
There, the economic calendar for the US and the EU is uneventful. It means that trading volumes are likely to be low. All important events are scheduled for later this week.
What's on charts:
Support and resistance levels (resistance /support) are thick red lines near which the trend may end. They do not provide trading signals.
The Kijun-sen and Senkou Span B lines are the lines of the Ichimoku indicator plotted to the H1 chart from the 4H one. They are strong lines.
Extreme levels are thin red lines from which the price bounced earlier. They provide trading signals.
Yellow lines are trend lines, trend channels, and any other technical patterns.
Indicator 1 on the COT charts is the net position size of each category of traders.
Indicator 2 on the COT charts is the net position size for the "Non-commercial" group of traders.
Le recensioni analitiche di InstaForex ti renderanno pienamente consapevole delle tendenze del mercato! Essendo un cliente InstaForex, ti viene fornito un gran numero di servizi gratuiti per il trading efficiente.


