 Rimani
Condizioni di trading
Strumenti


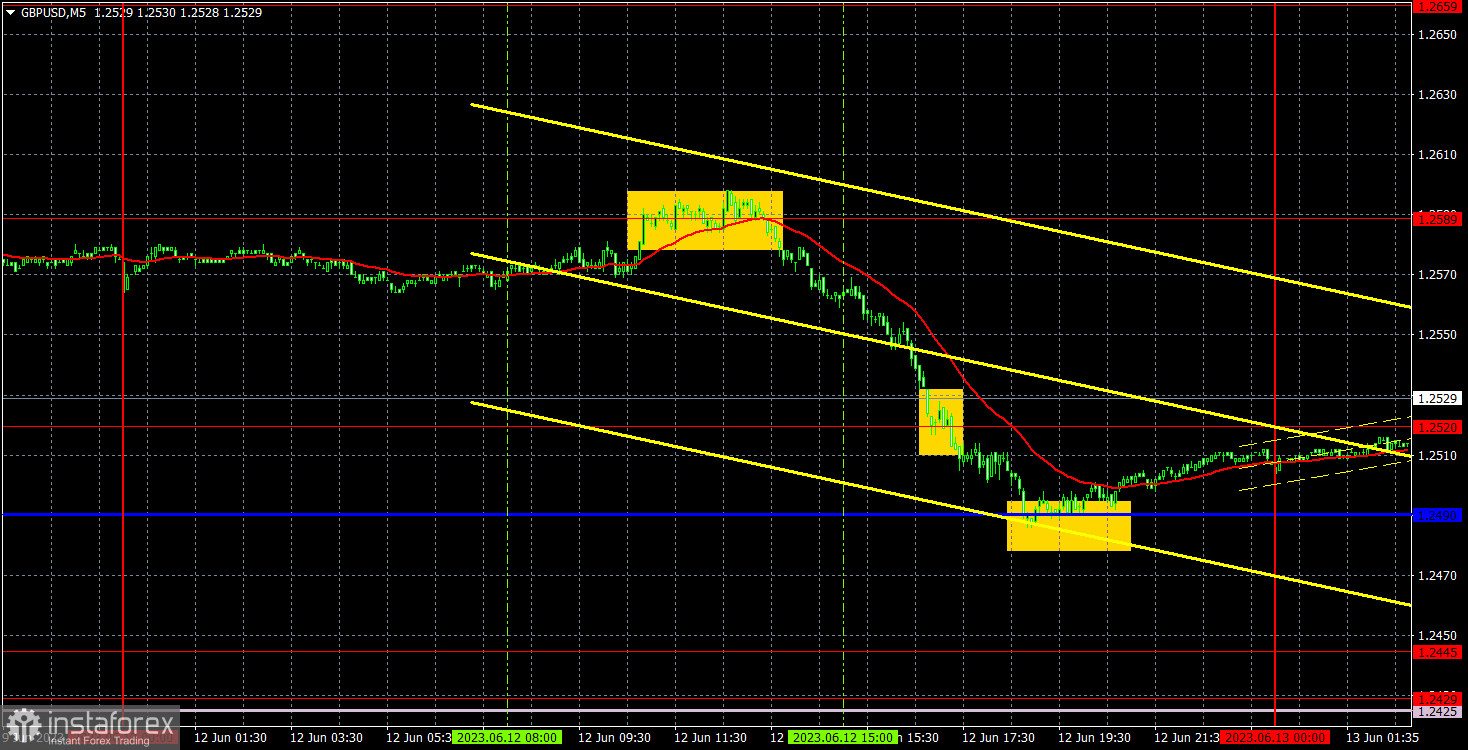
GBP/USD was trading bearish on Monday and lost about 110 pips at the moment. In the previous article, we mentioned that the pair can change the direction of the movement every time, as there is very little logic now. GBP, unlike the EUR, started to rise, which is hard to explain. We made some suggestions as to why this may be happening in our fundamental articles, but even they look ambiguous and doubtful. The pound is showing record growth in 2023. There were no macroeconomic and fundamental events in the UK or US on Monday, which did not prevent the pair from showing volatility of over 100 points. The beginning of the week is encouraging. In spite of the illogical moves, the intraday moves themselves are quite good...
... and profitable! For example, yesterday, practically the only sell signal near the 1.2589 level made a profit of about 75 pips. The price moved in only one direction and did not even correct. Eventually, it reached the critical Kijun-sen line, from which it rebounded. At that point, shorts should have been closed. It was no longer advisable to execute a buy signal near the Kijun-sen as it was formed too late.
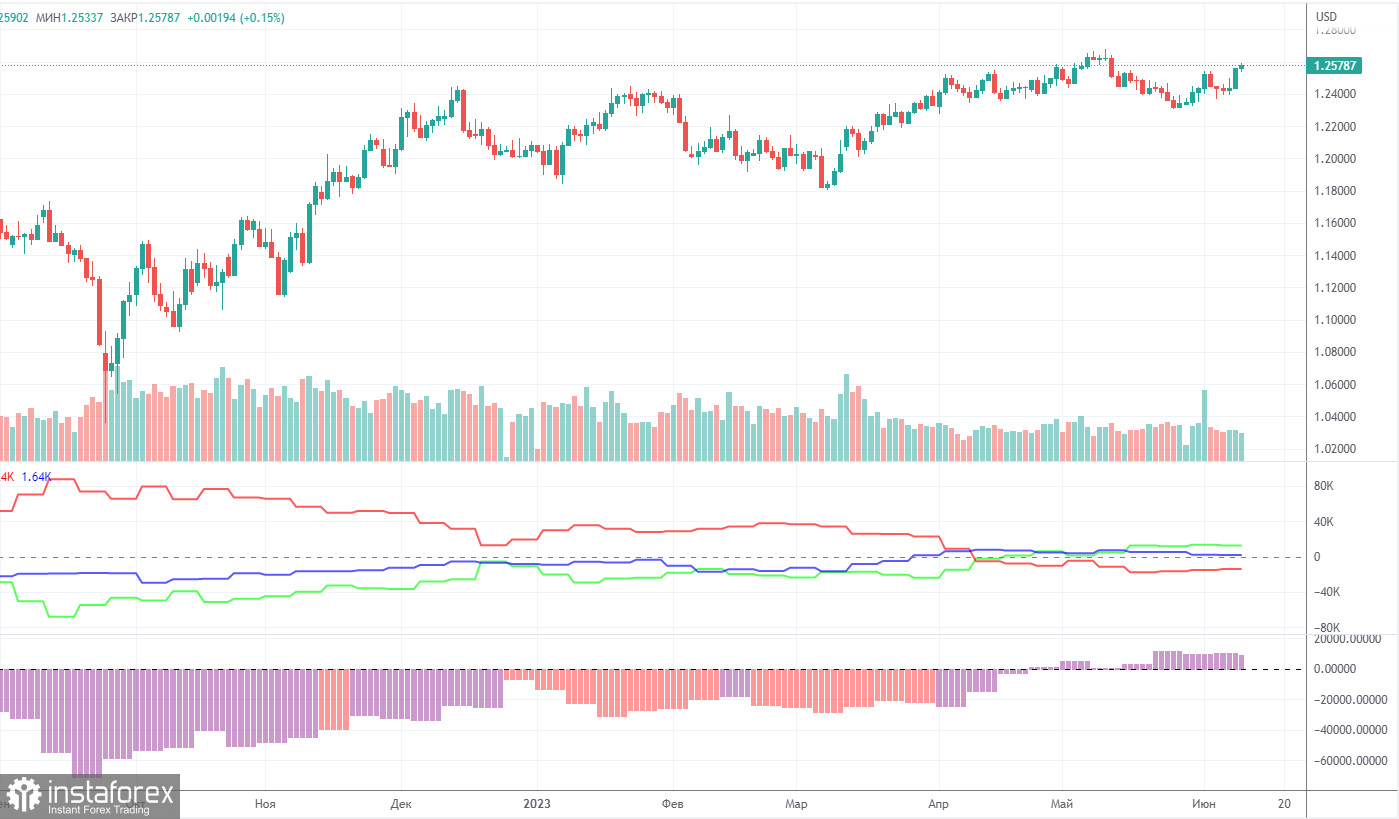
According to the latest report, non-commercial traders closed 5,200 long positions and 4,500 short ones. The net position dropped by 700 but remained bullish. Over the past 9-10 months, the net position has been on the rise despite bearish sentiment. In fact, sentiment is now bullish, but it is a pure formality. The pound is bullish against the greenback in the medium term, but there have been hardly any reasons for that. We assume that a prolonged bear run may soon begin even though COT reports suggest a bullish continuation. However, we can hardly explain why the uptrend should go on.
The pound has gained about 2,300 pips. Therefore, a bearish correction is now needed. Otherwise, a bullish continuation would make no sense even despite the lack of support from fundamental factors. Overall, non-commercial traders hold 52,500 sell positions and 65,000 long ones. We do not see the pair extending growth in the long term.
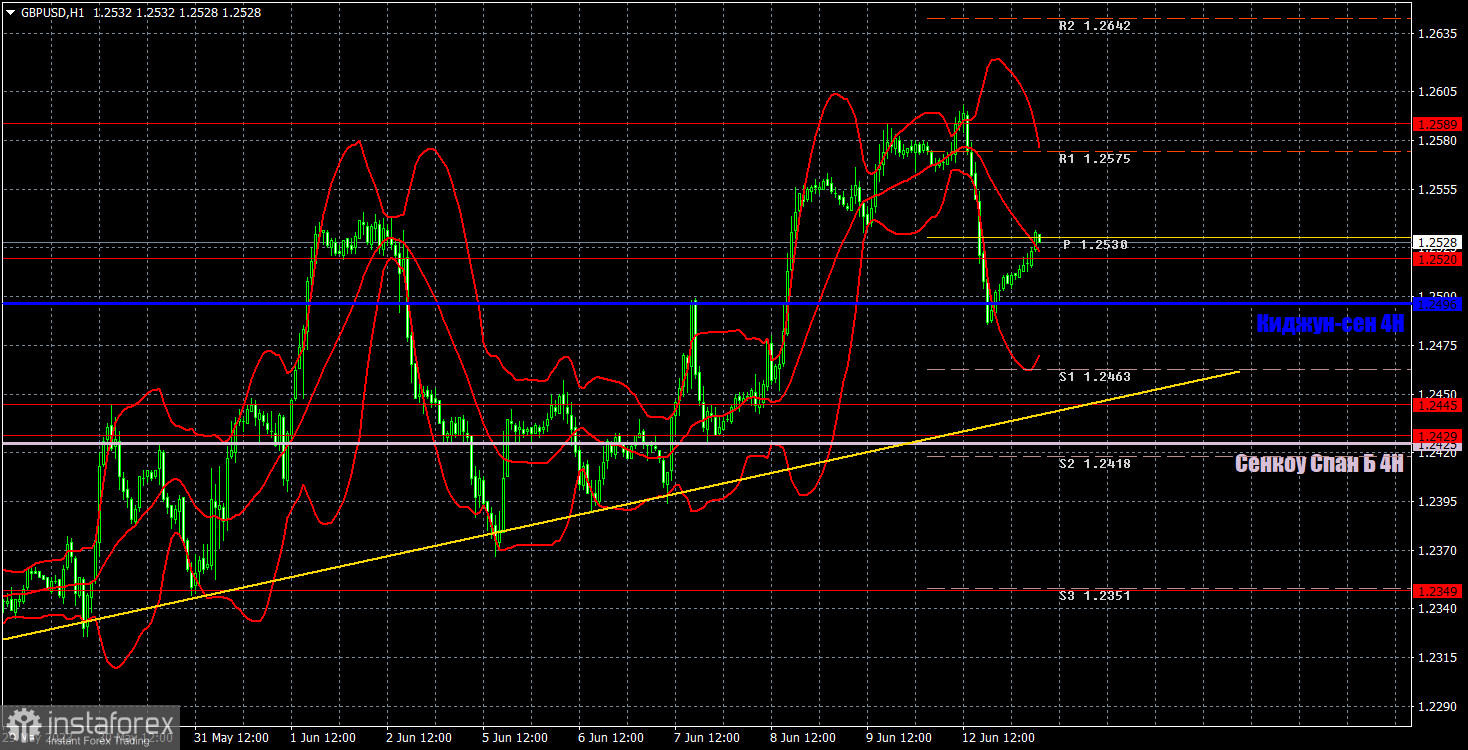
In the 1-hour chart, GBP/USD is moving up but abruptly and with pauses. There is currently an ascending trend line, and the price is above the Ichimoku indicator. Technically, a bullish continuation is possible. However, fundamentally and macroeconomically, it makes no sense. Nevertheless, it does not matter for intraday trading whether the price goes up or down. What matters is that it is a strong trend movement. This is exactly what we can expect from the pair this week, as Monday has shown.
On June 13, trading levels are seen at 1.2269, 1.2349, 1.2429-1.2445, 1.2520, 1.2589, 1.2666, 1.2762. The Senkou Span B (1.2425) and Kijun-sen (1.2496) lines may also generate signals when the price either breaks or bounces off them. A Stop Loss should be placed at the breakeven point when the price goes 20 pips in the right direction. Ichimoku indicator lines can move intraday, which should be taken into account when determining trading signals. There are also support and resistance which can be used for locking in profits.
On Tuesday, reports on unemployment, wages, and unemployment benefit claims are scheduled for release in the UK, which will be known in an hour. In the US, the inflation report for May will be published. All the aforementioned reports are significant and can provoke a strong market reaction.
Resistance/support - thick red lines, near which the trend may stop. They do not make trading signals.
The Kijun-sen and Senkou Span B lines are the Ichimoku indicator lines moved to the hourly timeframe from the 4-hour timeframe. They are also strong lines.
Extreme levels are thin red lines, from which the price used to bounce earlier. They can produce trading signals.
Yellow lines are trend lines, trend channels, and other technical patterns.
Indicator 1 on the COT chart is the size of the net position of each trader category.
Indicator 2 on the COT chart is the size of the net position for the Non-commercial group of traders.
Le recensioni analitiche di InstaForex ti renderanno pienamente consapevole delle tendenze del mercato! Essendo un cliente InstaForex, ti viene fornito un gran numero di servizi gratuiti per il trading efficiente.

