 Rimani
Condizioni di trading
Strumenti


There were no significant events in the macroeconomic calendar, and it was a day off in the United States. As a result, there was a decrease in trading volumes, which negatively affected market volatility.
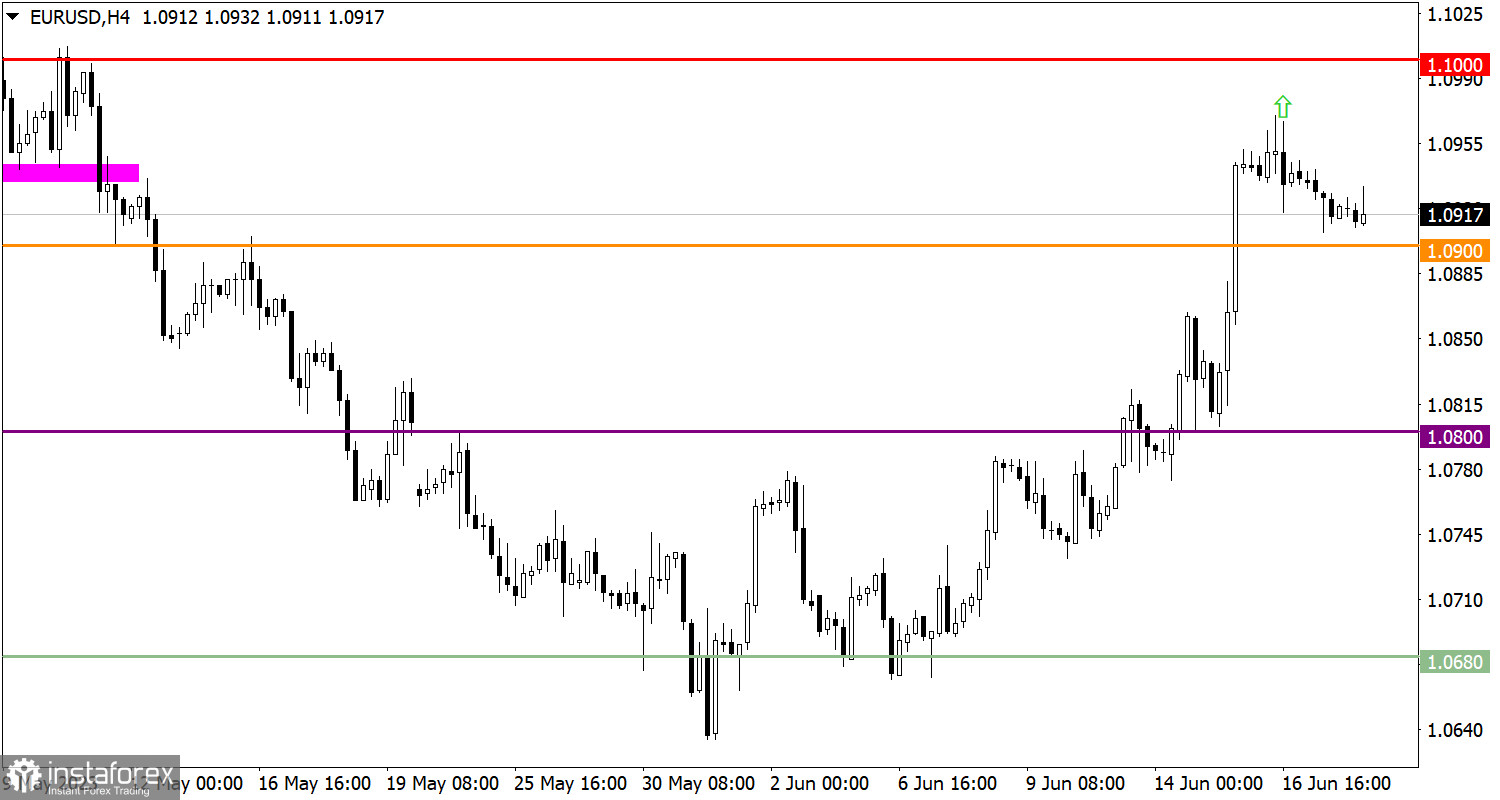
EUR/USD was able to partially alleviate its overbought status during a price correction. This is a positive step in reshuffling trading forces in the market.
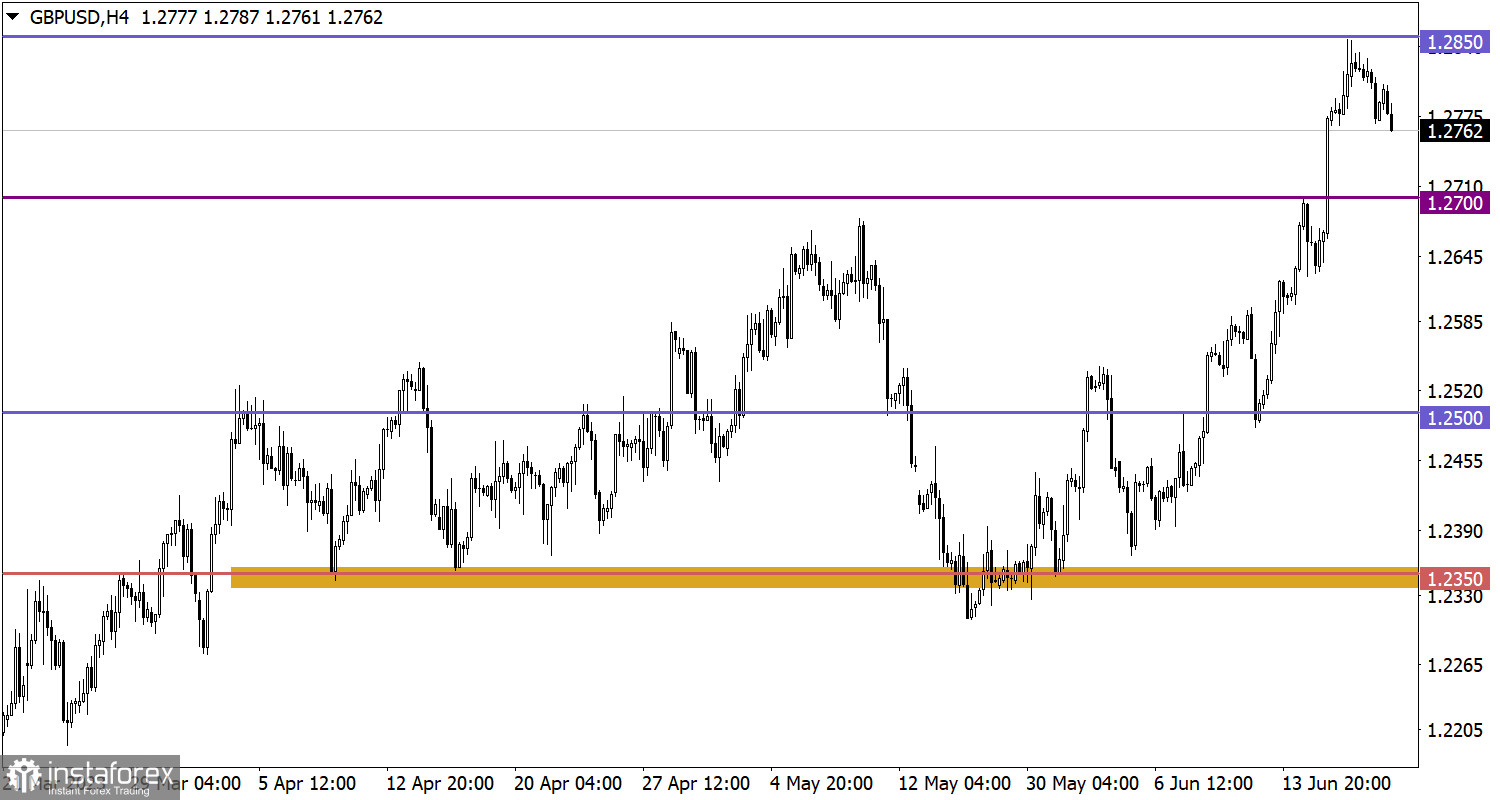
GBP/USD slowed down its upward cycle around the 1.2850 level, leading to a reduction in long positions. As a result, a correction formed, which, considering the overbought status of the British currency, is a justified move in the market.

Today, the publication of data on the U.S. construction sector is expected to attract investor attention. A decline in new home construction may indicate a possible slowdown in economic growth, while an increase in the number of permits issued may indicate future growth in the construction industry. The impact of this data on financial markets is likely to be limited, but they can have an influence on specific market sectors.
However, a more significant impact on the markets may come from the speeches of European Central Bank (ECB) and the Federal Reserve System (Fed) representatives. If the topic of interest rates is addressed in these speeches, it can cause a significant reaction in financial markets, as decisions on interest rates have a substantial impact on the economy and monetary policy.
Subsequent price growth is expected after surpassing the 1.0950 level. In case this value is exceeded, a price shift towards the upper zone of the psychological level 1.1000/1.1050 is possible. If the price remains below the 1.0900 level, a transition from a correction phase to a full-fledged downward correction is possible. It is important to consider these factors and price dynamics when analyzing the market to make informed decisions.
The price correction is still relevant in the market, but it does not disrupt the rhythmic component of the upward trend. If it continues to form, a move towards the 1.2700 level is possible. However, in the case of a continuation of the upward scenario, a signal for the continuation of the medium-term trend will be confirmed by holding the price above the 1.2850 level.
The candlestick chart type is white and black graphic rectangles with lines above and below. With a detailed analysis of each individual candle, you can see its characteristics relative to a particular time frame: opening price, closing price, intraday high and low.
Horizontal levels are price coordinates, relative to which a price may stop or reverse its trajectory. In the market, these levels are called support and resistance.
Circles and rectangles are highlighted examples where the price reversed in history. This color highlighting indicates horizontal lines that may put pressure on the asset's price in the future.
The up/down arrows are landmarks of the possible price direction in the future.
Le recensioni analitiche di InstaForex ti renderanno pienamente consapevole delle tendenze del mercato! Essendo un cliente InstaForex, ti viene fornito un gran numero di servizi gratuiti per il trading efficiente.


