 Rimani
Condizioni di trading
Strumenti


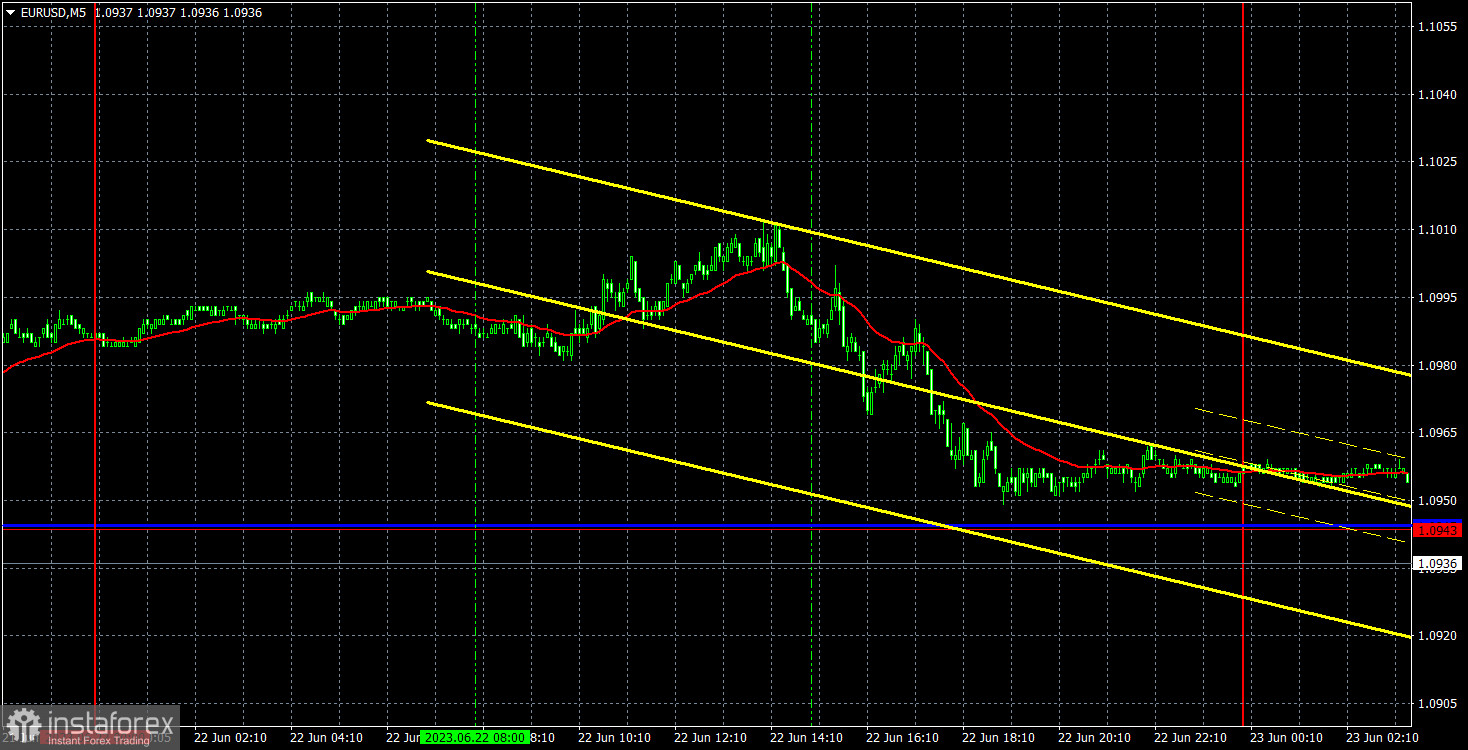
The EUR/USD pair resumed a downward movement yesterday. The fact is that there were very few important events for the euro or the US dollar yesterday. Jerome Powell testified before the Senate. Initial jobless claims data was revealed. The Bank of England announced its rate decision, which could have also affected the euro. It is hard to say what exactly led to the fall of the euro by 35 pips at the end of the day. It could also be a technical drop due to profit-taking on long positions. The pair could break the ascending trend line today, as well as the critical Kijun-sen line, which may end the current trend.
There were no trading signals yesterday. Market volatility was slightly more than 60 pips. This is rather weak but still more than the pair has shown in recent days. With such volatility, traders need time to enter at the very beginning of the movement and exit at the very end in order to make a profit. Therefore, it's even better that there were no trading signals on Thursday. A sell signal appeared tonight after the pair broke through the critical line. This signal could bring gains.
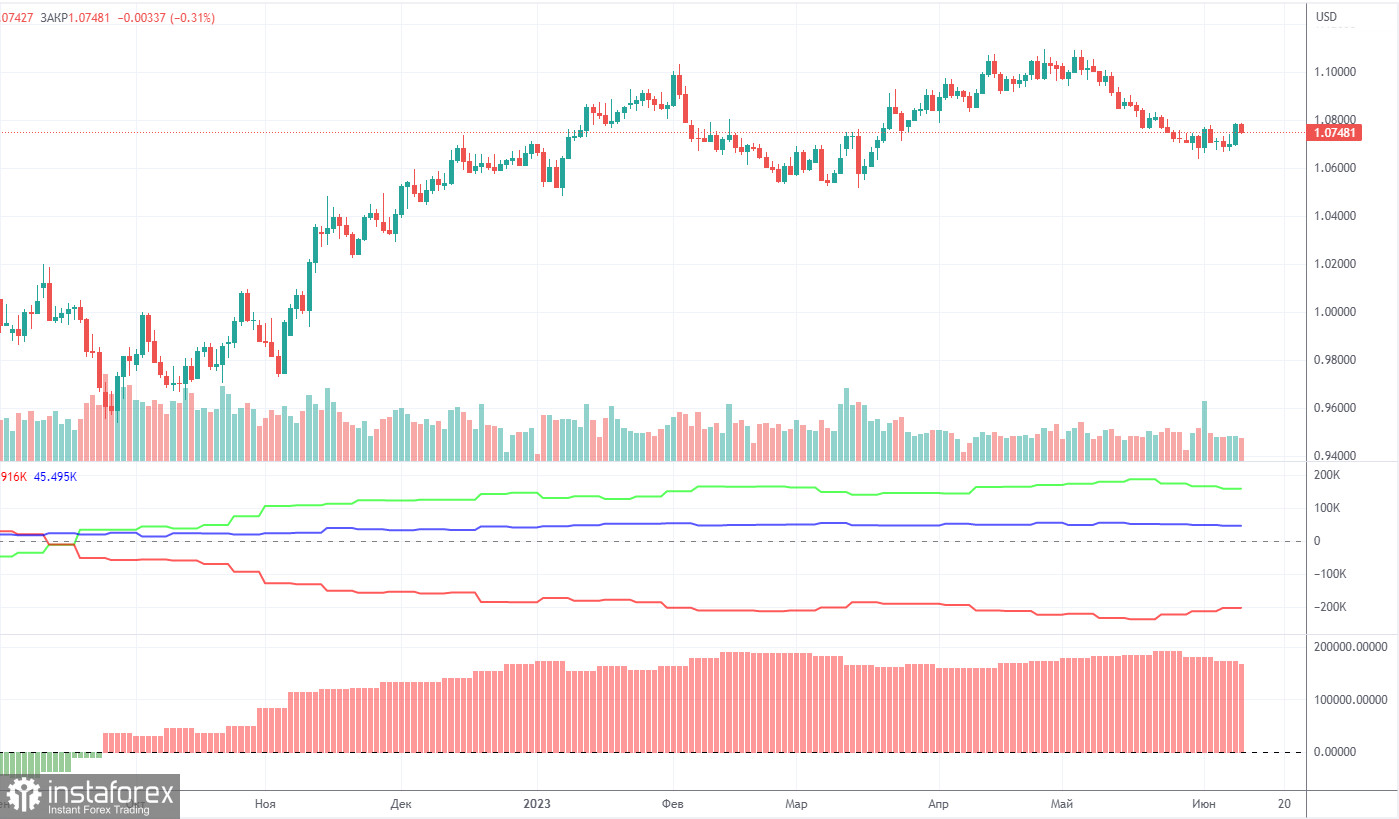
The latest COT report was released on June 6. In the last 9 months, COT reports have fully corresponded to what is happening on the market. The chart above clearly shows that the net position of big traders (the second indicator) began to grow again in September 2022. At the same time, the euro resumed an upward movement. The net position of non-commercial traders is bullish. The euro is trading at its highs against the US dollar.
I have already mentioned that a fairly high value of the "net position" indicates the end of the uptrend. The first indicator also signals such a possibility as the red and green lines are very far from each other. It often occurs before the end of the trend. The euro tried to start falling a few months ago but there was only a pullback. During the last reporting week, the number of long positions of the "Non-commercial" group of traders decreased by 5,700 and the number of short positions rose by 1,500. The number of long positions is higher than the number of short ones. This is a very large gap. The number of long positions is 59,000 higher than short ones. The difference is more than three times. The correction has begun. Yet, it may not be a correction but the start of a new downtrend. At this time, it is clear that the pair is likely to resume a downward movement without COT reports.
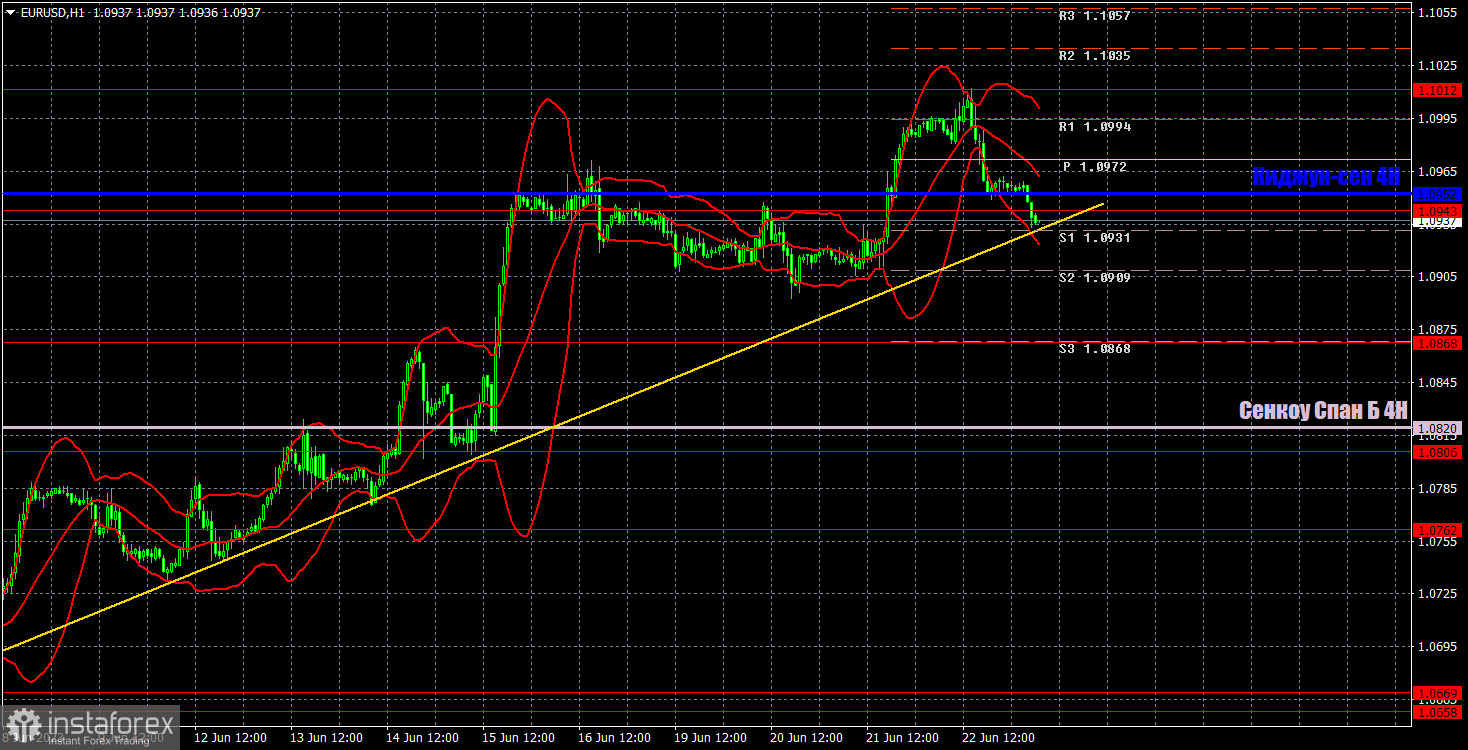
On the 1H timeframe, the pair still retains the uptrend but it may end today. Some traders have been waiting for a drop for a long time as such a scenario is the most reasonable. In case of breaking through the trend line, the pair could sink to the Senkou Span B line.
On June 23, one should pay attention to the following levels: 1.0658-1.0669, 1.0762, 1.0806, 1.0868, 1.0943, 1.1092, 1.1137, as well as the Senkou Span B (1.0820) and Kijun-sen (1.0952) lines. The lines of the Ichimoku indicator can move during the day. Bear it in mind when determining trading signals. There are also support and resistance levels but they do not provide signals, e.g. bounces or breakouts from extreme levels and lines. Do not forget about placing a Stop Loss order at breakeven if the price moves in the right direction by 15 pips. It will you avoid losses if the signal turns out to be false.
The European Union, Germany, and the US will reveal their PMI indices today. However, these reports could only trigger slight volatility. Fed policymakers Bostic, Meister, and Bullard will make speeches. However, they will hardly say anything new. For this reason, their statements are unlikely to impact the trajectory of the pair.
What's on charts:
Support and resistance levels (resistance /support) are thick red lines near which the trend may end. They do not provide trading signals.
The Kijun-sen and Senkou Span B lines are the lines of the Ichimoku indicator plotted to the H1 chart from the 4H one. They are strong lines.
Extreme levels are thin red lines from which the price bounced earlier. They provide trading signals.
Yellow lines are trend lines, trend channels, and any other technical patterns.
Indicator 1 on the COT charts is the net position size of each category of traders.
Indicator 2 on the COT charts is the net position size for the "Non-commercial" group of traders.
Le recensioni analitiche di InstaForex ti renderanno pienamente consapevole delle tendenze del mercato! Essendo un cliente InstaForex, ti viene fornito un gran numero di servizi gratuiti per il trading efficiente.


