 Rimani
Condizioni di trading
Strumenti


The preliminary data on Eurozone inflation for June was published on Friday. The monthly consumer price index rose by 0.3%, exceeding expectations of 0%. On an annual basis, inflation fell from 6.1% to 5.5%, slightly better than forecasts of 5.6%.
Similarly, the core consumer price index (excluding food and energy prices) increased from 5.3% to 5.4% on an annual basis, surpassing expectations of 5.5%. The monthly core inflation stood at 0.3%, which also turned out to be better than expectations of 0.7%.
Thus, it can be concluded that the decline in energy prices has dampened the inflationary impulse. However, the core inflation, excluding these factors, demonstrated a stable character, and the European Central Bank will need more time to bring it back to the target level of 2%.
Therefore, the current inflation data is unlikely to have a significant impact on the ECB's opinion regarding further tightening of monetary policy and the duration of maintaining high interest rates, as Christine Lagarde has already mentioned.
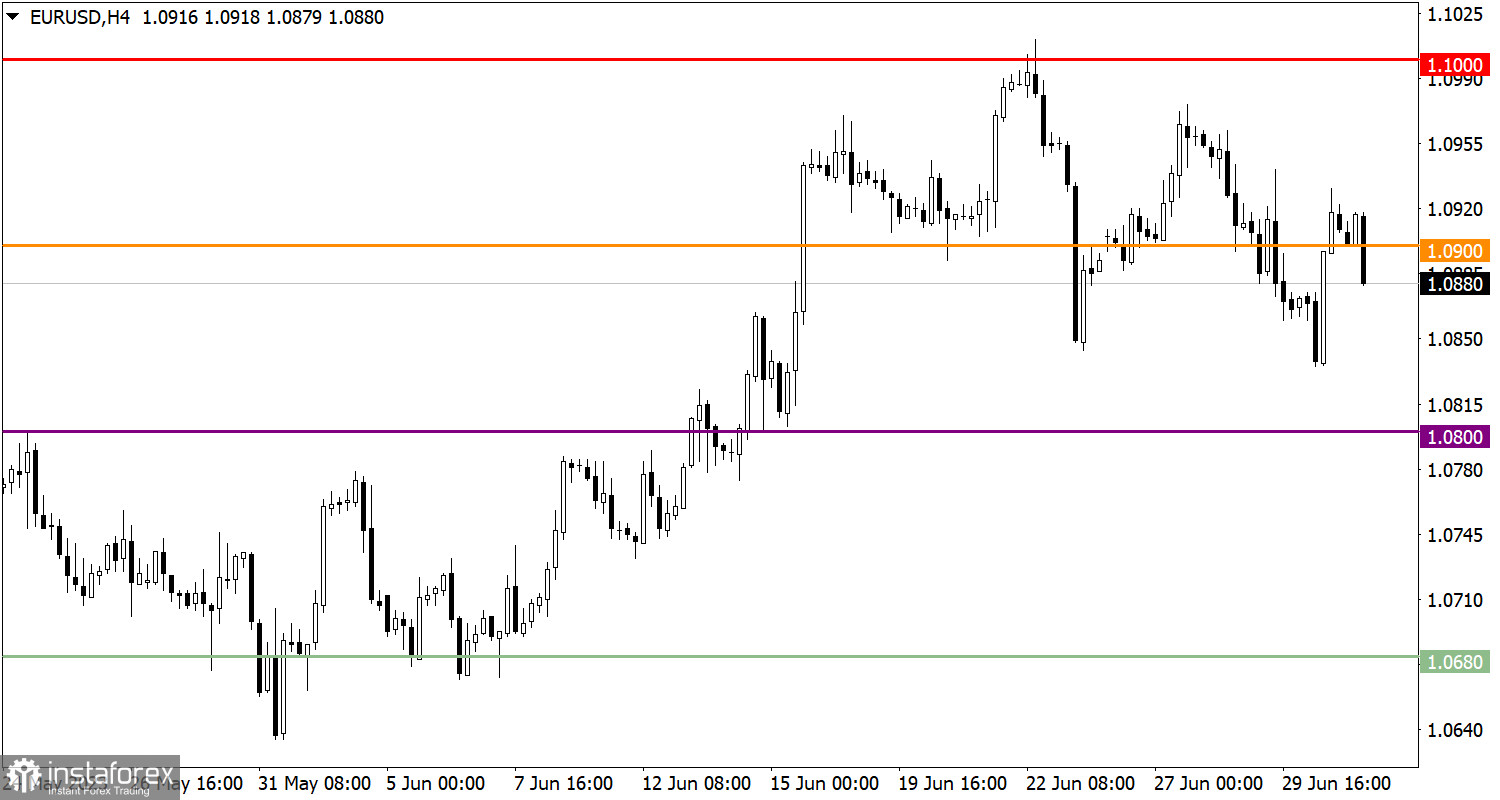
On Friday, the euro demonstrated an upward impulse against the U.S. dollar, leading to a price increase above the 1.0900 mark.
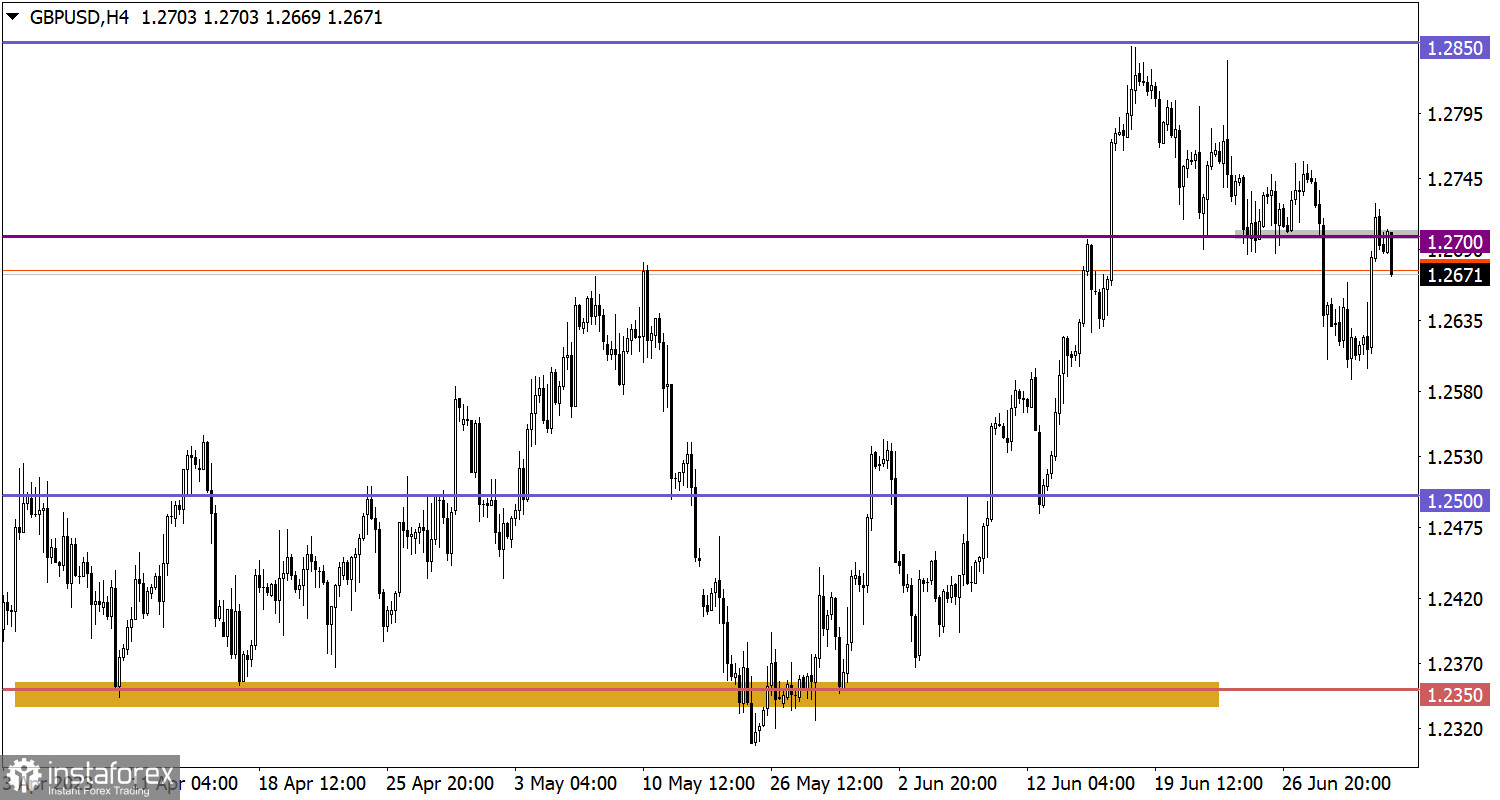
The GBP/USD currency pair slowed down its downward trend around 1.2600, where a reverse price surge occurred amid a decline in dollar positions. This led to the price returning above the 1.2700 level.

Today, the publication of final business activity index data for the manufacturing sector is expected for the Eurozone, the United Kingdom, and the United States. Although these data have already been preliminarily assessed, their final results may confirm or significantly differ from expectations. In the case of significant deviations from forecasts, this can trigger market speculation and impact financial markets.
Despite significant price changes in the market, a corrective movement continues. A return of the price below the 1.0850 level may lead to a continuation of the downward cycle. To activate an upward scenario and increase the volume of long positions, the quote needs to rise above the 1.0950 level. In this case, a breakout of the resistance level at 1.1000 is possible.
To continue the growth of long positions, it is necessary for the quote to stay above 1.2750. In this case, the next stage of recovery in the value of the pound sterling after the recent corrective movement may occur.
As for a possible subsequent downward movement, a return of the price below the 1.0650 level may trigger the activation of short positions. This step will lead to an update of the local low of the corrective cycle.
The candlestick chart type is white and black graphic rectangles with lines above and below. With a detailed analysis of each individual candle, you can see its characteristics relative to a particular time frame: opening price, closing price, intraday high and low.
Horizontal levels are price coordinates, relative to which a price may stop or reverse its trajectory. In the market, these levels are called support and resistance.
Circles and rectangles are highlighted examples where the price reversed in history. This color highlighting indicates horizontal lines that may put pressure on the asset's price in the future.
The up/down arrows are landmarks of the possible price direction in the future.
Le recensioni analitiche di InstaForex ti renderanno pienamente consapevole delle tendenze del mercato! Essendo un cliente InstaForex, ti viene fornito un gran numero di servizi gratuiti per il trading efficiente.

