 Rimani
Condizioni di trading
Strumenti


Retail sales in the eurozone in May of this year remained unchanged compared to the previous month, according to Eurostat data. Analysts, on average, expected a 0.2% increase. Compared to May 2022, retail sales fell by 2.9%, with forecasts of a 2.7% decline. The euro reacted almost insignificantly to this data.
During the American trading session, a large package of statistical data from the United States was published. The first thing investors noticed was the ADP report, which indicated that the U.S. labor market showed no signs of weakening in June, as the number of new jobs was significantly higher than expected.
As for unemployment benefit claims, there was a slight decrease in the overall figure. The sharp decline in the number of job openings attracted the most interest.
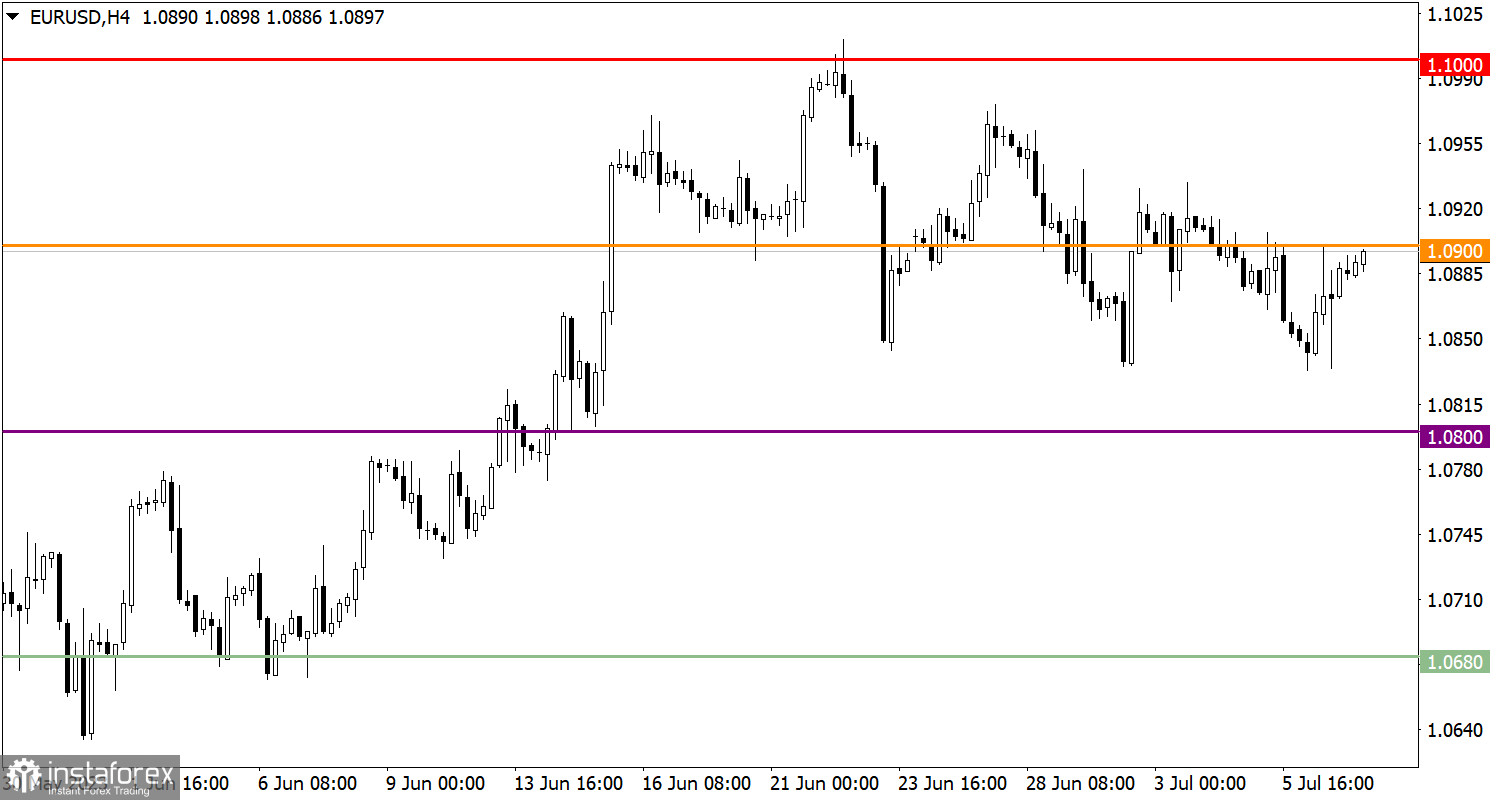
The EUR/USD currency pair rebounded from the support area of 1.0840/1.0850, repeating the amplitude of the previous week, which led the quote back to the level of 1.0900.
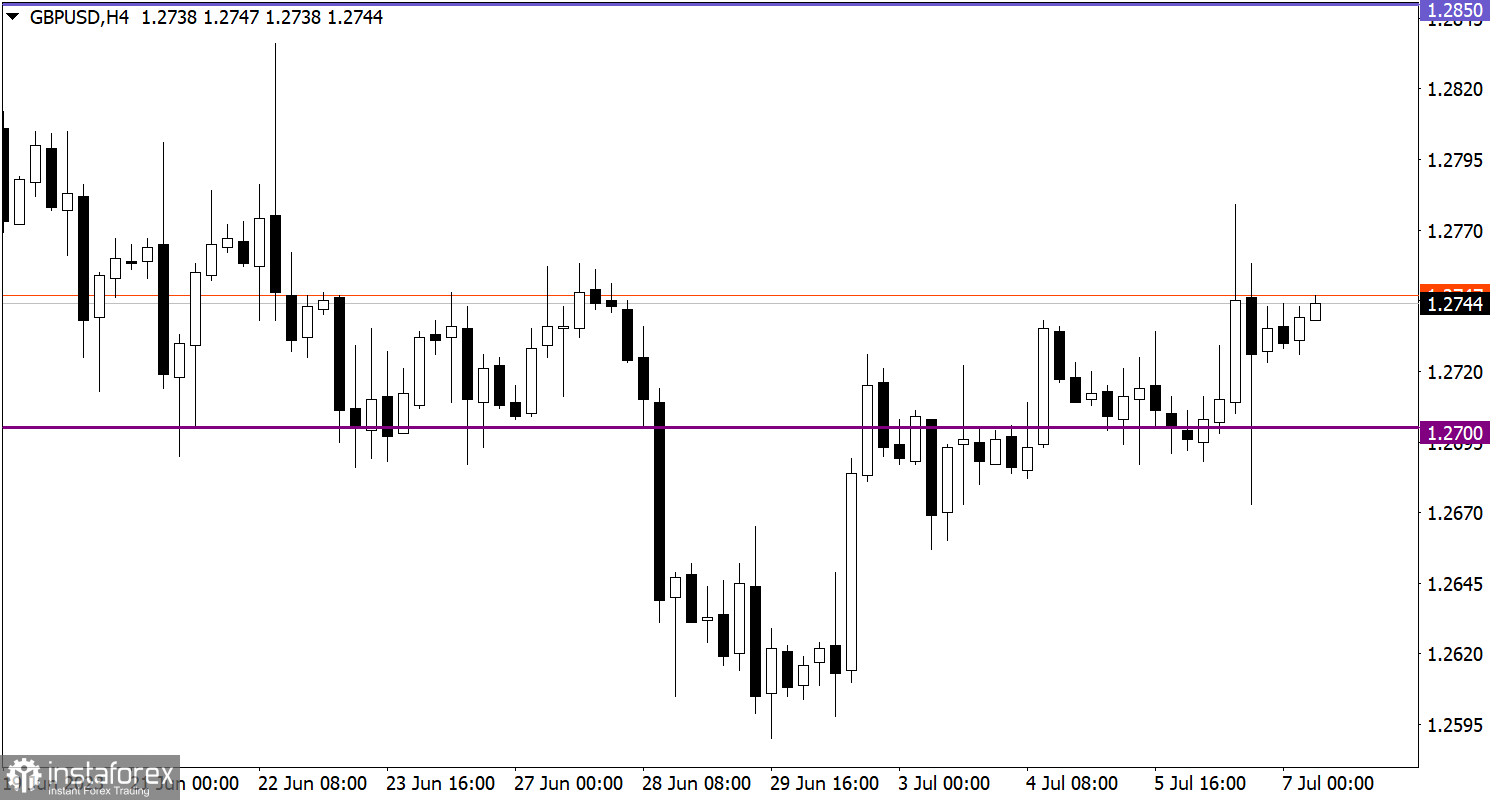
The GBP/USD pair completed a phase of consolidation near the level of 1.2700, caused by a speculative impulse that temporarily pushed the quote up to 1.2779. This movement indicates the prevailing bullish sentiment among market participants.

Today, the report from the U.S. Department of Labor is expected to be published, and it is forecasted that the unemployment rate will remain unchanged. A noticeable decline in the number of new jobs created outside agriculture is also expected, but it may still exceed the 200,000 mark. Thus, the labor market situation should remain relatively stable.
In this situation, stable price retention above the level of 1.0900 may lead to further increase in the volume of long positions. However, to confirm the technical signal of the end of the current corrective movement, it is necessary for the price to return above the value of 1.0950. Until that moment, there is a risk of continued correction from the resistance level of 1.1000.
In this situation, stable price retention above 1.2750 may indicate a subsequent increase in the volume of long positions. This, in turn, may lead to further recovery in the value of the British pound after the recent corrective movement.
Traders will consider the bearish scenario only if the price falls below 1.2700.
The candlestick chart type is white and black graphic rectangles with lines above and below. With a detailed analysis of each individual candle, you can see its characteristics relative to a particular time frame: opening price, closing price, intraday high and low.
Horizontal levels are price coordinates, relative to which a price may stop or reverse its trajectory. In the market, these levels are called support and resistance.
Circles and rectangles are highlighted examples where the price reversed in history. This color highlighting indicates horizontal lines that may put pressure on the asset's price in the future.
The up/down arrows are landmarks of the possible price direction in the future.
Le recensioni analitiche di InstaForex ti renderanno pienamente consapevole delle tendenze del mercato! Essendo un cliente InstaForex, ti viene fornito un gran numero di servizi gratuiti per il trading efficiente.

