 Rimani
Condizioni di trading
Strumenti


The final assessment of the Eurozone's GDP for the second quarter of 2023 was published, reflecting a year-on-year growth of 0.5% and a quarter-on-quarter growth of 0.1%. However, preliminary and intermediate estimates had suggested higher growth of 0.6% and 0.3%, respectively.
During the American trading session, data on jobless claims in the United States were also published, and the volume of these claims decreased. Detailed statistical data shows that the volume of initial jobless claims fell from 229,000 to 216,000, while the volume of continuing claims fell from 1.719 million to 1.679 million.
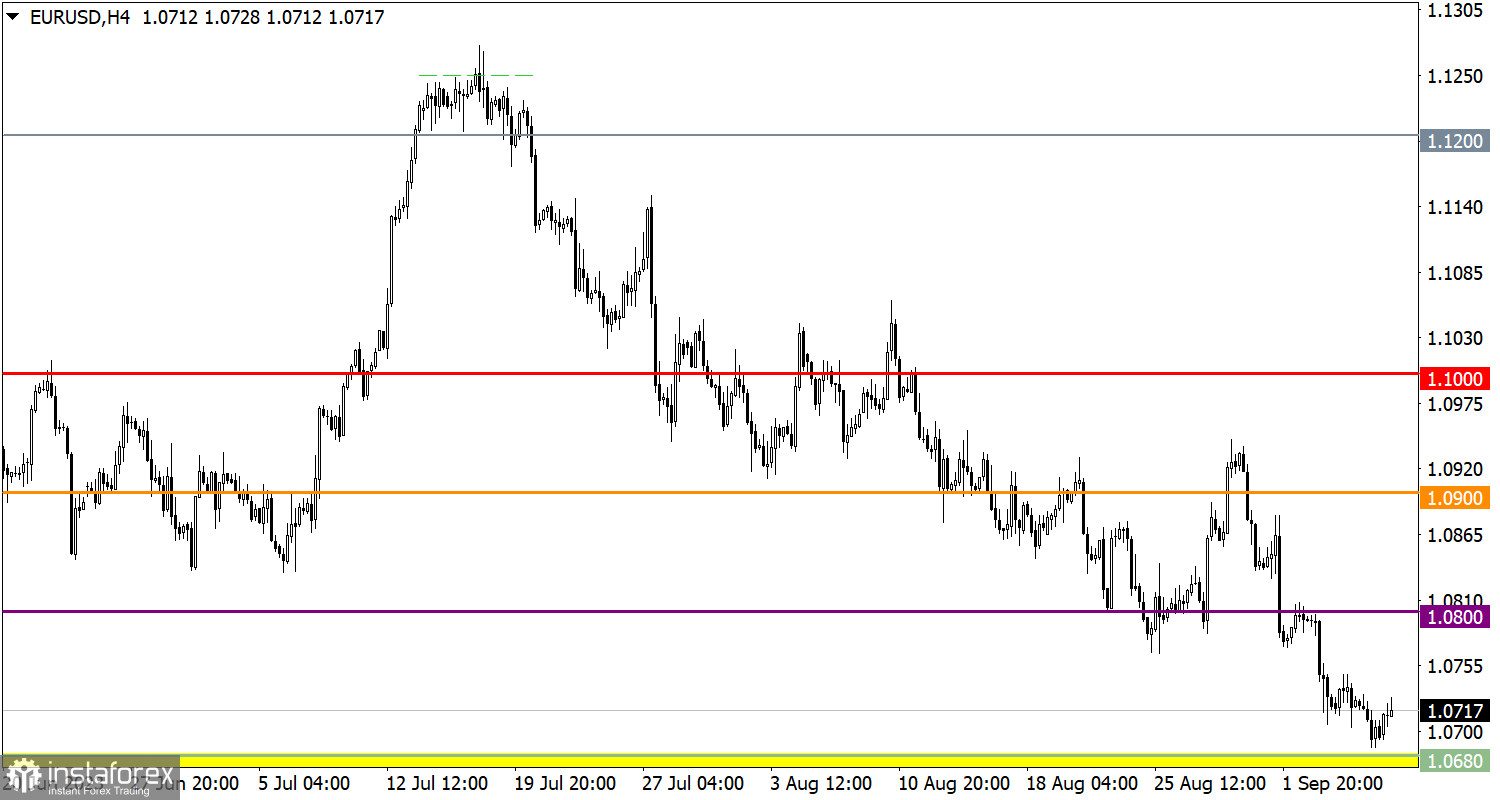
The EUR/USD exchange rate slowed its decline and stabilized around the 1.0700 mark. This happened after the volume of short positions decreased, leading to a temporary price consolidation with subsequent price rebound.
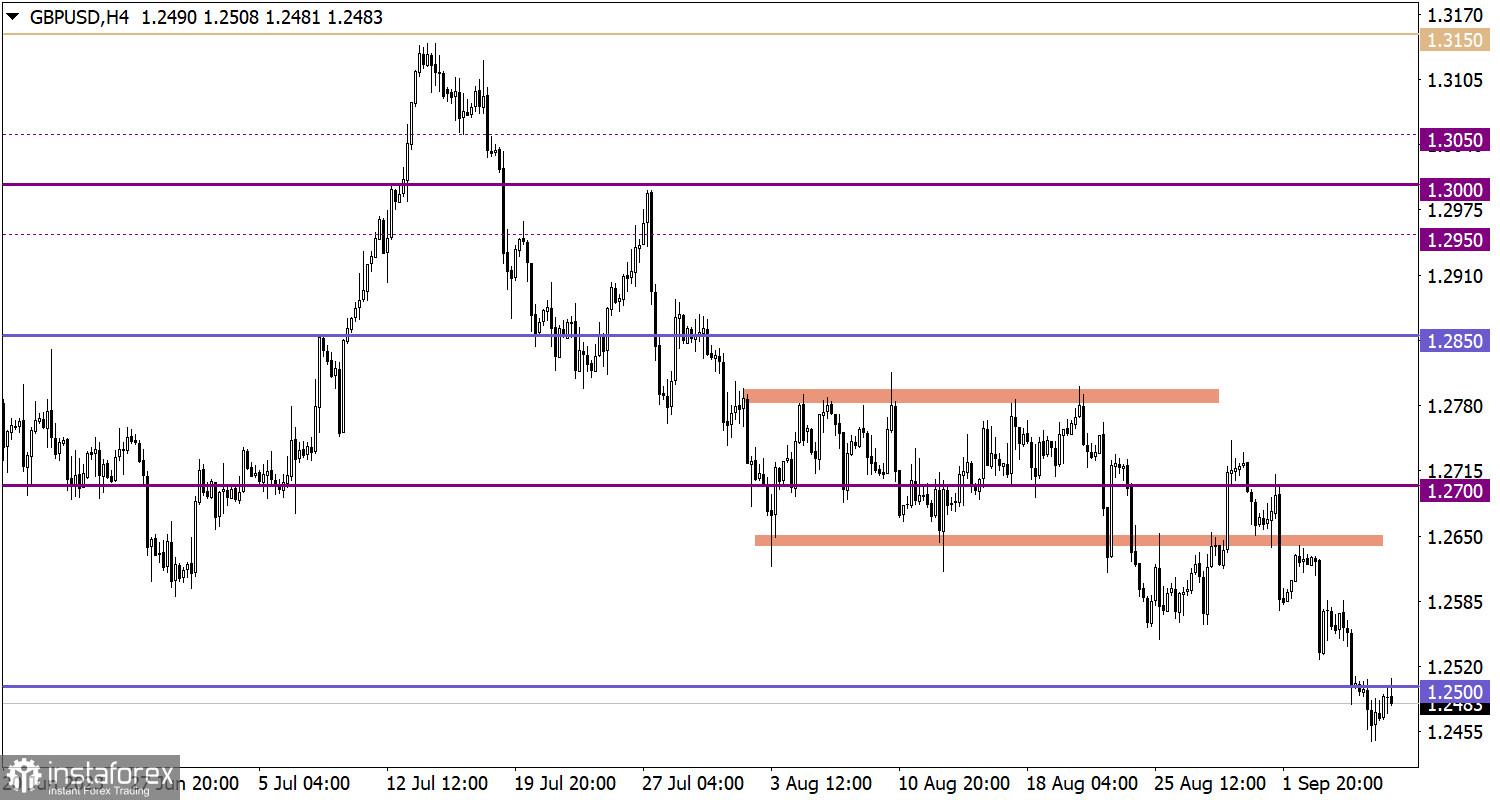
On the other hand, the GBP/USD exchange rate reached the level of 1.2450 during an inertia-driven movement, and here too, a reduction in the volume of short positions was observed. Several technical indicators in the market indicate an oversold status of the British currency, which may suggest a potential change in trading interests.

The trading week concludes with an empty macroeconomic calendar. No significant statistical data is expected to be published in the Eurozone, the United Kingdom, or the United States.
For further depreciation of the euro, the price must remain consistently below the level of 1.0700. In such a case, speculators may ignore technical signals of euro overselling, potentially leading to the start of a new phase of depreciation towards the low reached in June. As for the scenario of euro recovery, some technical indicators hint at the possibility of an upward movement, with the quote potentially heading towards the level of 1.0800.
If the price remains steadily above the level of 1.2500, it may lead to an increase in the volume of long positions, which could strengthen the current rebound from the downward cycle in the market. As for the possibility of a continuation of the downward movement, traders will only consider this scenario if the price returns below the level of 1.2450.
The candlestick chart type is white and black graphic rectangles with lines above and below. With a detailed analysis of each individual candle, you can see its characteristics relative to a particular time frame: opening price, closing price, intraday high and low.
Horizontal levels are price coordinates, relative to which a price may stop or reverse its trajectory. In the market, these levels are called support and resistance.
Circles and rectangles are highlighted examples where the price reversed in history. This color highlighting indicates horizontal lines that may put pressure on the asset's price in the future.
The up/down arrows are landmarks of the possible price direction in the future.
Le recensioni analitiche di InstaForex ti renderanno pienamente consapevole delle tendenze del mercato! Essendo un cliente InstaForex, ti viene fornito un gran numero di servizi gratuiti per il trading efficiente.

