 Rimani
Condizioni di trading
Strumenti


On Thursday, EUR/USD plummeted after the ECB policy announcement. The central bank raised its key interest rate by 0.25%. Importantly, the likelihood of monetary policy tightening was not 100%. In recent months, rumors had circulated about a possible pause in September. Christine Lagarde evaded answering journalists' questions about interest rates last week. All of this strained investors' nerves, with the euro falling. However, yesterday, when the rate hike was announced, nothing changed. The euro extended its decline. Such a reaction seems illogical at the moment, but we want to remind you that the market often prices in many fundamental events in advance. Then, we see an asset's movement in the opposite direction which appears illogical. A clear example is the US dollar. The Fed had been raising the funds rate for a year, but the US dollar had been falling for a year in parallel, as the market had already factored in this aspect. Therefore, we believe that the euro's decline yesterday is entirely justified.
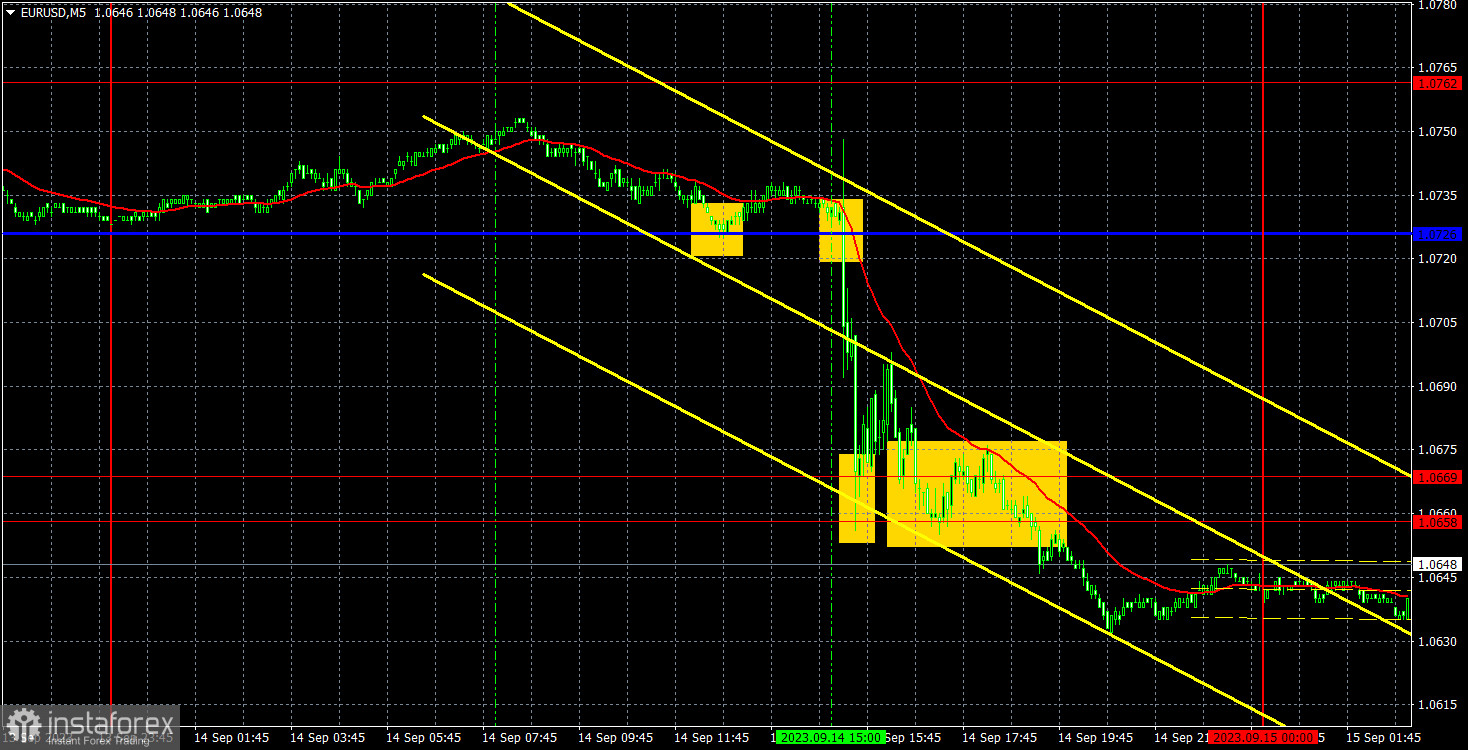
However, trading signals yesterday were very poor. It made no sense to trade the first buy signal as the ECB meeting was scheduled just a couple of hours later. The next sell signal was formed following the ECB announcement, leaving no opportunity to act on it. The next buy signal emerged 15 minutes later after the announcement. The final sell signal came in the evening when it was time to exit the market rather than open new positions. The best decision yesterday would have been to remain on the sidelines.
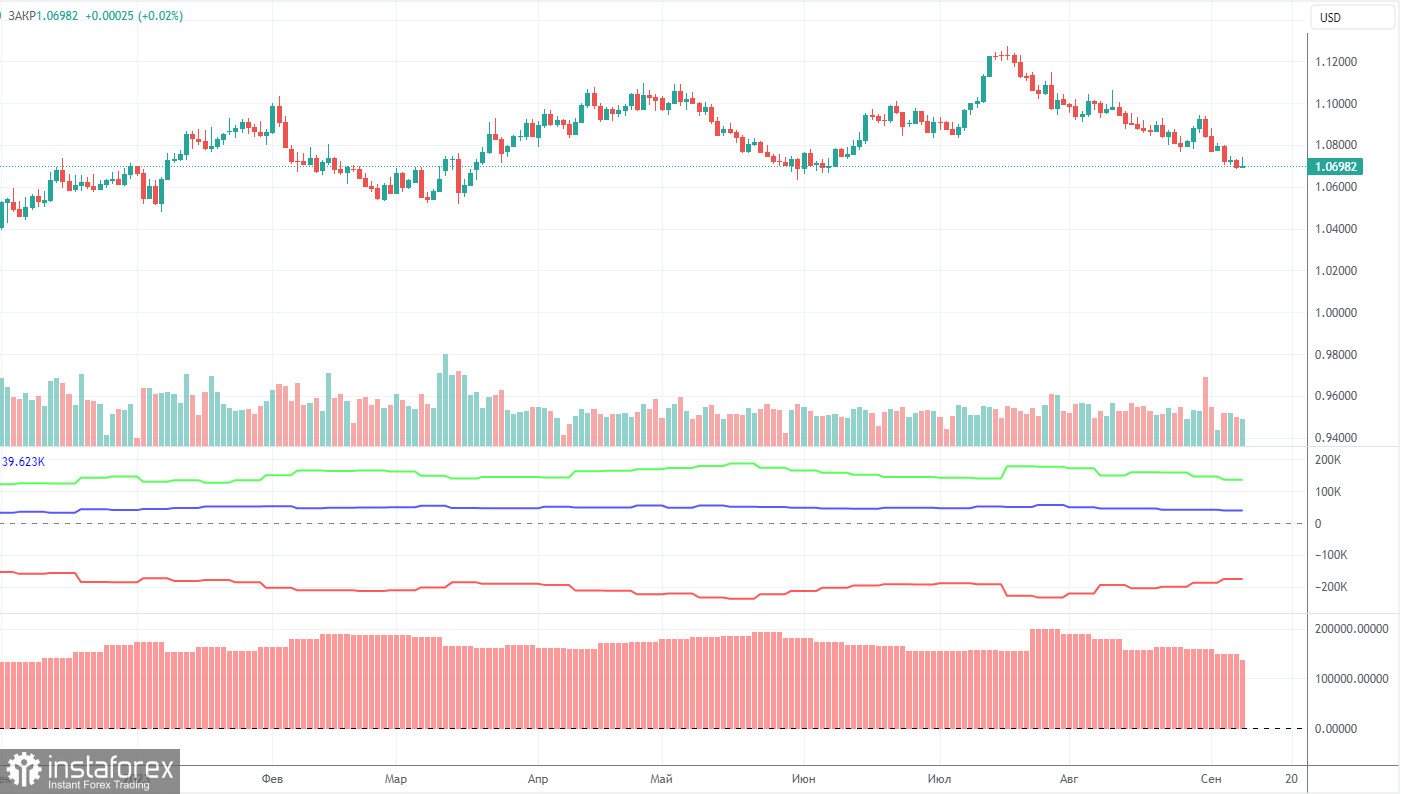
On Friday, a new COT report was released for the week ended on September 5th. For the past 12 months, the data from COT reports fully matched market trends. The net position of large market players (the second indicator) began to grow in September 2022. At around the same time, the European currency started its advance. For the past 6-7 months, the net position hasn't increased much, yet the euro remains relatively high and weakens unwillingly. At present, the net position of non-commercial traders remains bullish and strong, while the European currency continues to be too overvalued compared to the dollar.
We have previously pointed traders' attention to the fact that a rather high value of net positions suggests the end of an uptrend. This is suggested by the first indicator where the red and green lines have significantly diverged from each other, which commonly precedes the trend's completion. Over the last report week, the number of buy contracts for the "Non-commercial" group increased by 5.2K, while the shorts increased by 15.6K. As a result, the net position decreased by 10.4K contracts. The number of buy contracts exceeds the number of sell contracts by 136K among non-commercial traders, which is still a considerable gap. Essentially, even without COT reports, it's evident that the European currency is set to continue its decline.
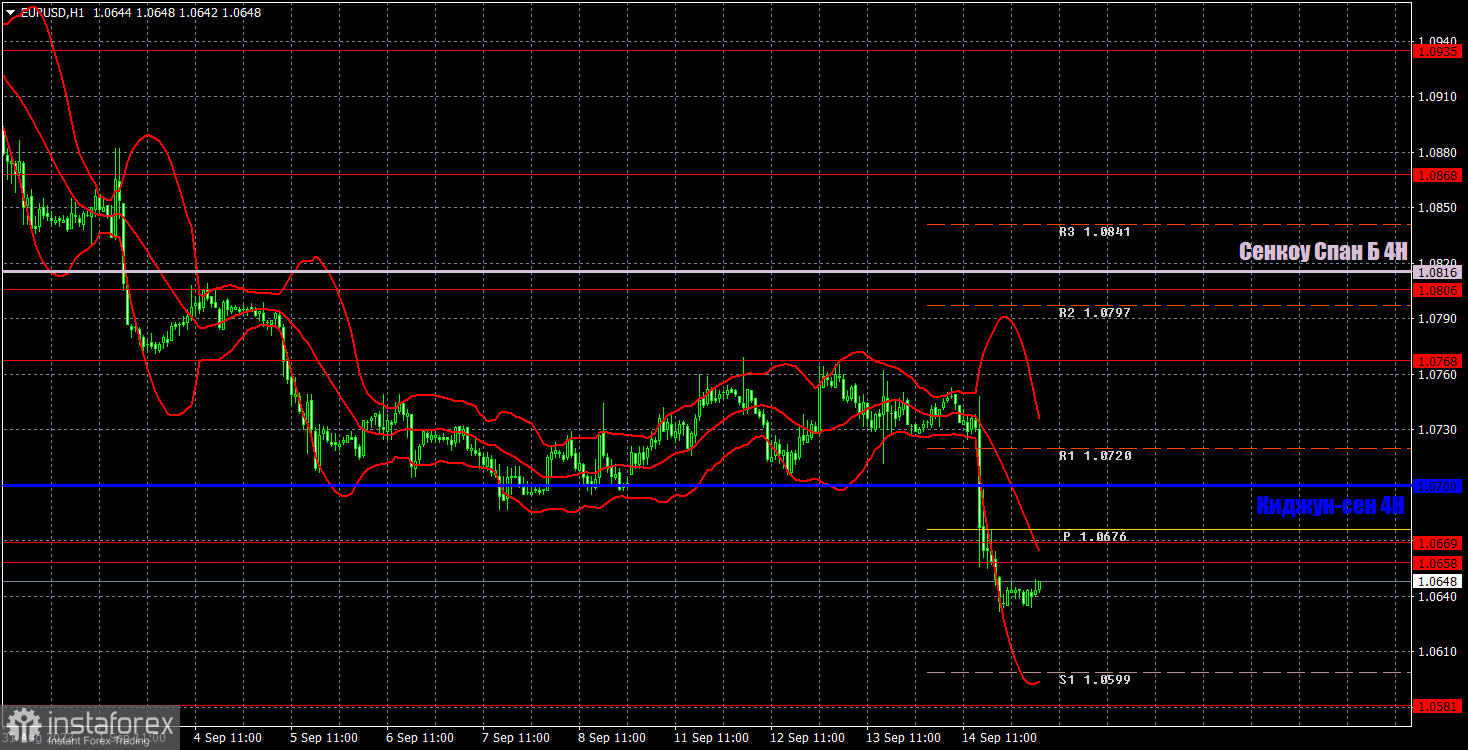
On the 1-hour timeframe, the currency pair maintains a downtrend. It hasn't managed to correct, and there's no solid reason for strong growth. We previously warned that the euro's fall could resume at any moment. It did resume, surprisingly on Thursday when it was least expected. However, the overall decline of the euro is absolutely logical and justified. We believe it will continue in the medium term.
For September 15th, we highlight the following trading levels: 1.0485, 1.0537, 1.0581, 1.0658-1.0669, 1.0768, 1.0806, 1.0868, 1.0935, 1.1043, 1.1092, and also the Senkou Span B line (1.0816) and the Kijun-sen line (1.0700). Throughout the day, the Ichimoku indicator lines may shift, which should not be neglected when identifying trading signals. There are also auxiliary support and resistance levels, but I don't see any trading signals around them. Bounces and breakouts of extreme levels and lines can serve as signals. Don't forget to set a Stop Loss order at breakeven if the price has moved in the right direction by 15 points. This will safeguard against potential losses if the signal turns out to be false.
On Friday, a new speech by Christine Lagarde is scheduled in the European Union, but we believe that the ECB's President stated all the essential points at the press conference and nothing of interest to the market will be discovered on Friday. In the US, there are two reports of secondary importance that have extremely low chances of being noticed by market participants.
What's on charts
Price levels of support and resistance (resistance / support) are plotted by thick red lines, near which the movement may end. They are not sources of trading signals.
The Kijun-sen and Senkou Span B lines are the Ichimoku indicator lines transferred to the 1-hour timeframe from the 4-hour timeframe. They are strong lines.
Extreme levels are thin red lines, from which the price bounced or dipped earlier. They are sources of trading signals.
Yellow lines are trend lines, trend channels and any other technical patterns.
Indicator 1 on the COT charts means the size of the net position of each category of traders.
Indicator 2 on the COT charts means the size of the net position for the Non-commercial group.
Le recensioni analitiche di InstaForex ti renderanno pienamente consapevole delle tendenze del mercato! Essendo un cliente InstaForex, ti viene fornito un gran numero di servizi gratuiti per il trading efficiente.

