 Rimani
Condizioni di trading
Strumenti


GBP/USD remained in a clear downtrend on Friday. Both major currency pairs showed different directions of movement, which happens rarely. However, volatility was weak, so it doesn't matter that the pound dropped by a few dozen points while the euro rose by a similar amount. The macroeconomic backdrop for the British currency was the same as for the euro. Nevertheless, the pound still maintains a descending trendline. We anticipate the pound's further decline against any fundamental backdrop, but the Bank of England and the Federal Reserve meetings will take place this upcoming week, as well as the release of the UK inflation report. We don't expect the BoE to provide strong support for its currency, but the market may react impulsively to its actions.
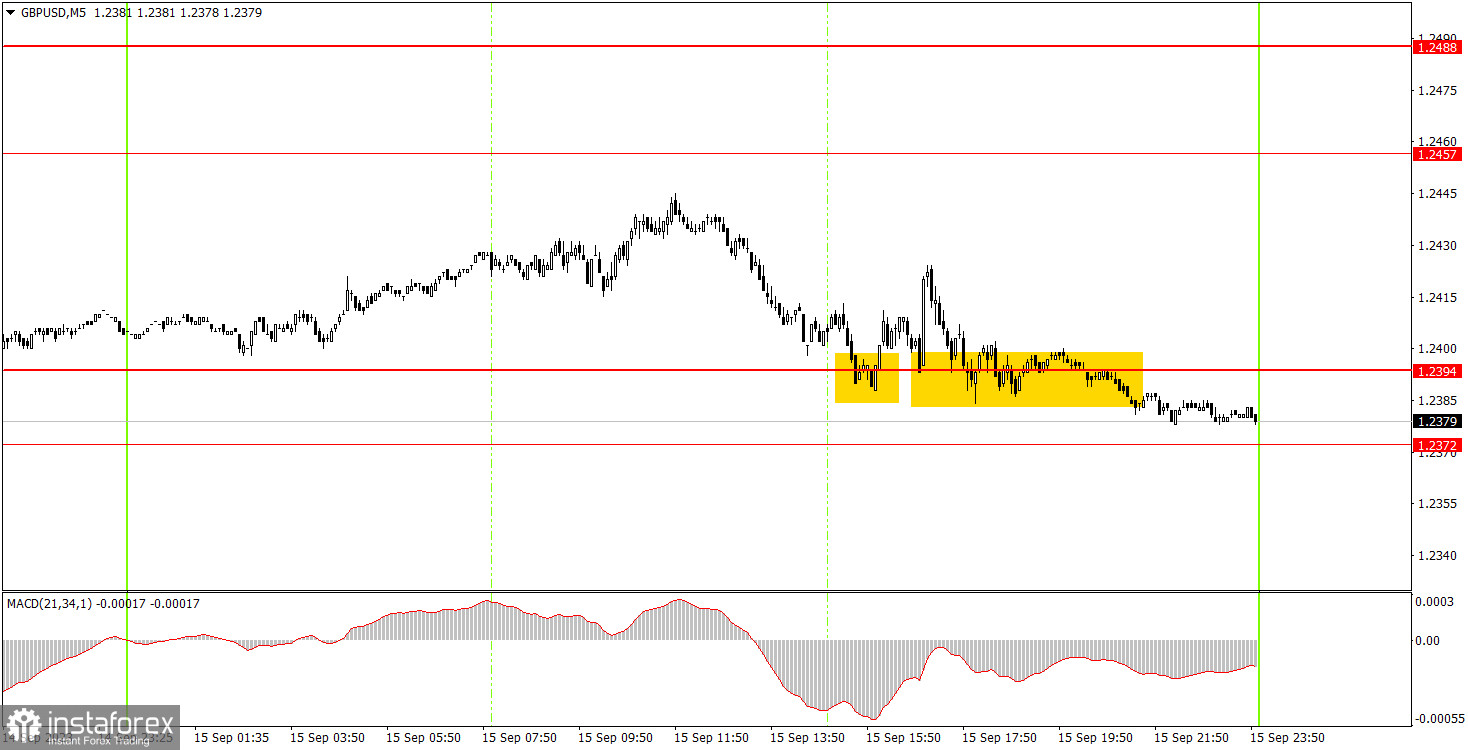
On the 5-minute chart, the pair initially attempted a bullish correction and then it fell to the 1.2372-1.2394 range, where it remained until the end of the day. In reality, the price only formed one buy signal, which was a bounce off 1.2394. This happened precisely during the release of the University of Michigan Consumer Sentiment Index. By the way, if anyone was curious about the market's reaction to the US reports, we can answer that the pair rose by 25 pips after the Michigan report. Since it rose by this amount in just 5 minutes, it was impossible to open a trade here in time. A long position could have been opened a little earlier, but it would have made no sense, as the pair's growth was barely enough to set a stop loss at break-even.
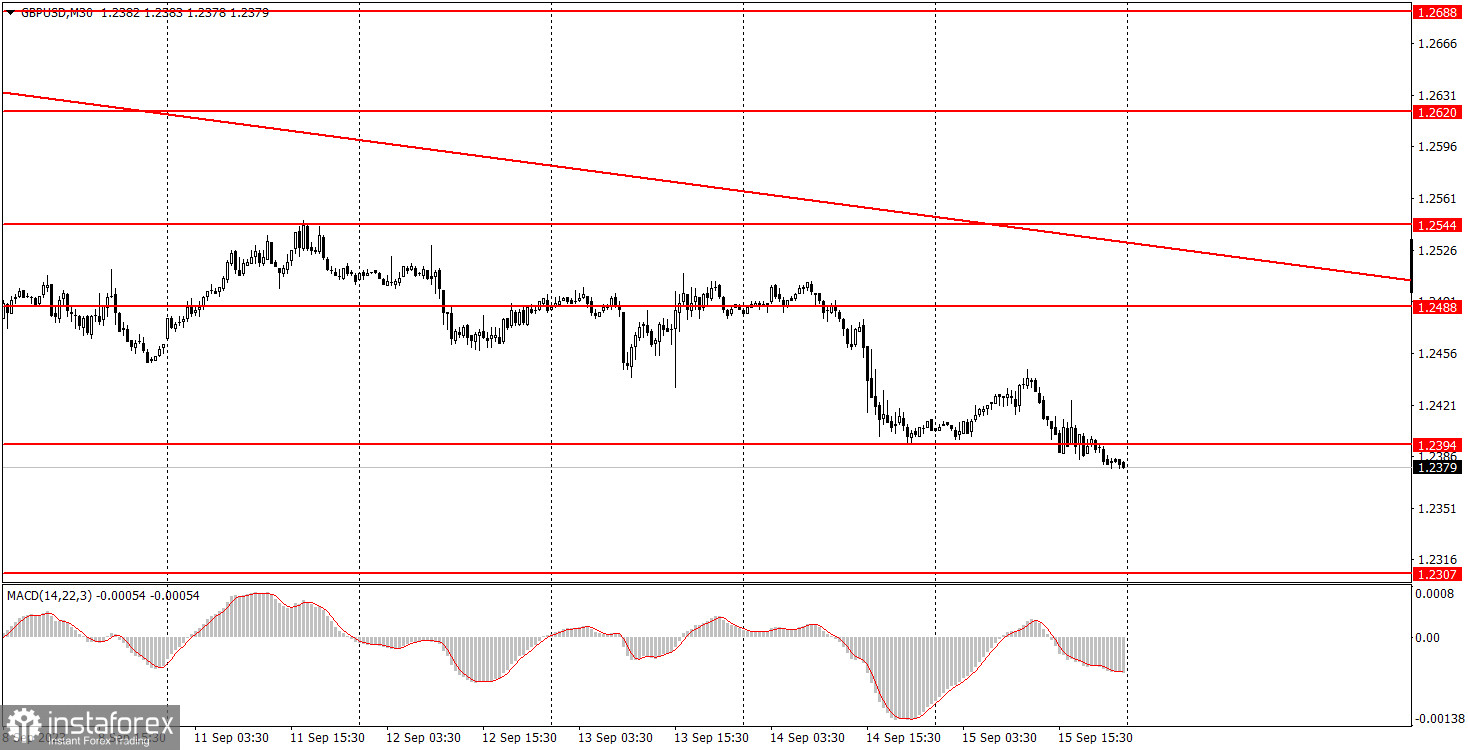
On the 30-minute chart, GBP/USD has ended a vague correction and has already resumed its downward movement. It's the same movement that we have been expecting since the beginning of 2023. A correction is possible again this week, but we find it difficult to envision a strong growth at this time. The key levels on the 5M chart are 1.2245, 1.2307, 1.2372, 1.2457-1.2488, 1.2544, 1.2605-1.2620, 1.2653, 1.2688, 1.2748, 1.2787-1.2791. Once the price moves 20 pips in the right direction after opening a trade, you can set the stop-loss at breakeven. On Monday, no important events lined up in the UK and the US. On the bright side, there will be many important events and reports later in the week. The main thing is to avoid a situation like last week when both pairs essentially stood still for 4 out of 5 days.
1) The strength of the signal depends on the time period during which the signal was formed (a rebound or a break). The shorter this period, the stronger the signal.
2) If two or more trades were opened at some level following false signals, i.e. those signals that did not lead the price to Take Profit level or the nearest target levels, then any consequent signals near this level should be ignored.
3) During the flat trend, any currency pair may form a lot of false signals or do not produce any signals at all. In any case, the flat trend is not the best condition for trading.
4) Trades are opened in the time period between the beginning of the European session and until the middle of the American one when all deals should be closed manually.
5) We can pay attention to the MACD signals in the 30M time frame only if there is good volatility and a definite trend confirmed by a trend line or a trend channel.
6) If two key levels are too close to each other (about 5-15 pips), then this is a support or resistance area.
Support and Resistance price levels can serve as targets when buying or selling. You can place Take Profit levels near them.
Red lines are channels or trend lines that display the current trend and show which direction is better to trade.
MACD indicator (14,22,3) is a histogram and a signal line showing when it is better to enter the market when they cross. This indicator is better to be used in combination with trend channels or trend lines.
Important speeches and reports that are always reflected in the economic calendars can greatly influence the movement of a currency pair. Therefore, during such events, it is recommended to trade as carefully as possible or exit the market in order to avoid a sharp price reversal against the previous movement.
Beginners should remember that every trade cannot be profitable. The development of a reliable strategy and money management are the key to success in trading over a long period of time.
Le recensioni analitiche di InstaForex ti renderanno pienamente consapevole delle tendenze del mercato! Essendo un cliente InstaForex, ti viene fornito un gran numero di servizi gratuiti per il trading efficiente.

