 Rimani
Condizioni di trading
Strumenti


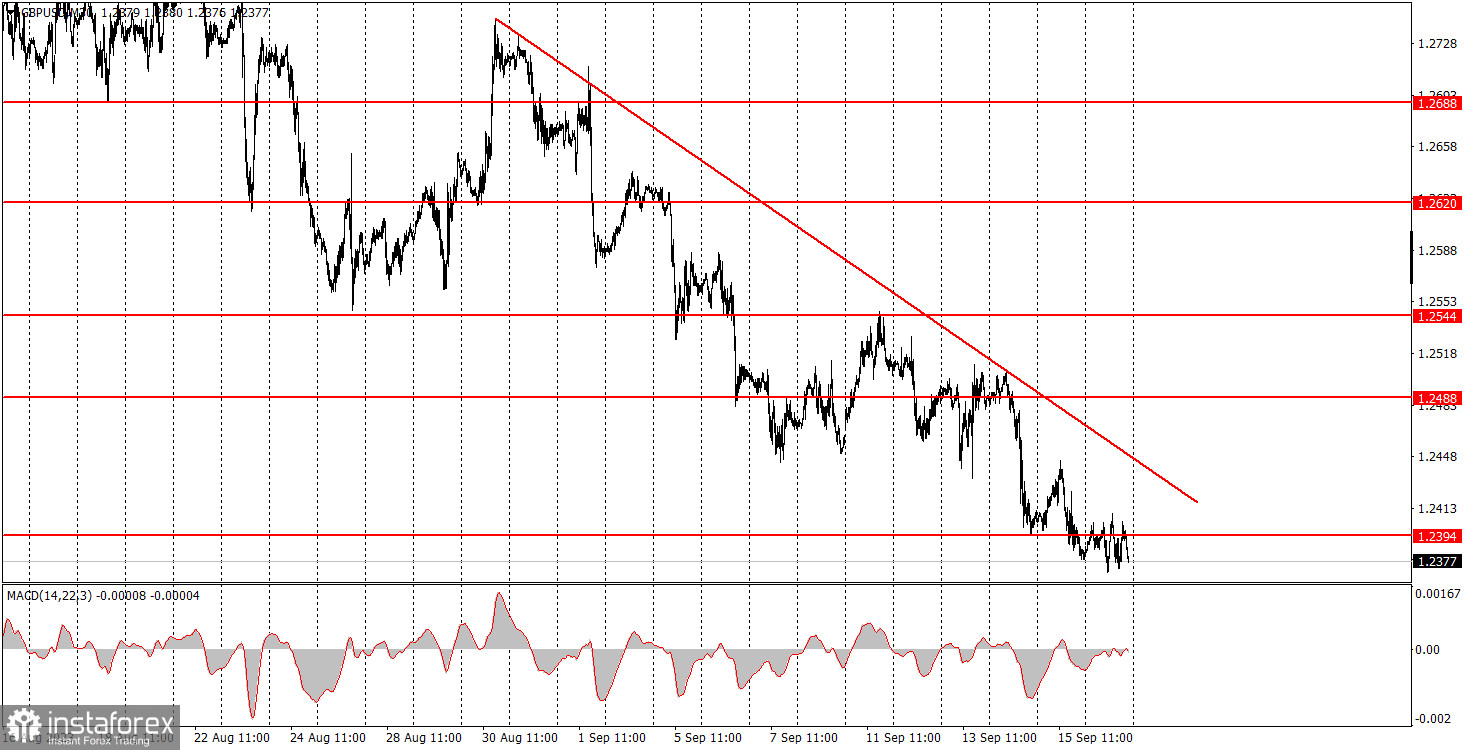
The GBP/USD pair maintained its decline on the outset of the week. To be precise, while it remained largely stationary today, this flatness does nothing to deter the overarching bearish momentum. Drawing a parallel to the euro, which is forming an upward corrective channel for the second time, the sterling's fall is notably more consistent, without long pauses. However, as mentioned, today was characterized by an absolute flat, devoid of any major or even secondary events in either the UK or the US. The downward trend line might be a tad ambiguous, but it illustrates the bearish trajectory. This week, the spotlight will be on meetings from the Federal Reserve and the Bank of England, hence, traders should be particularly vigilant about these events. In the face of such substantial fundamental news, it wouldn't be surprising to see the trend line being breached multiple times.
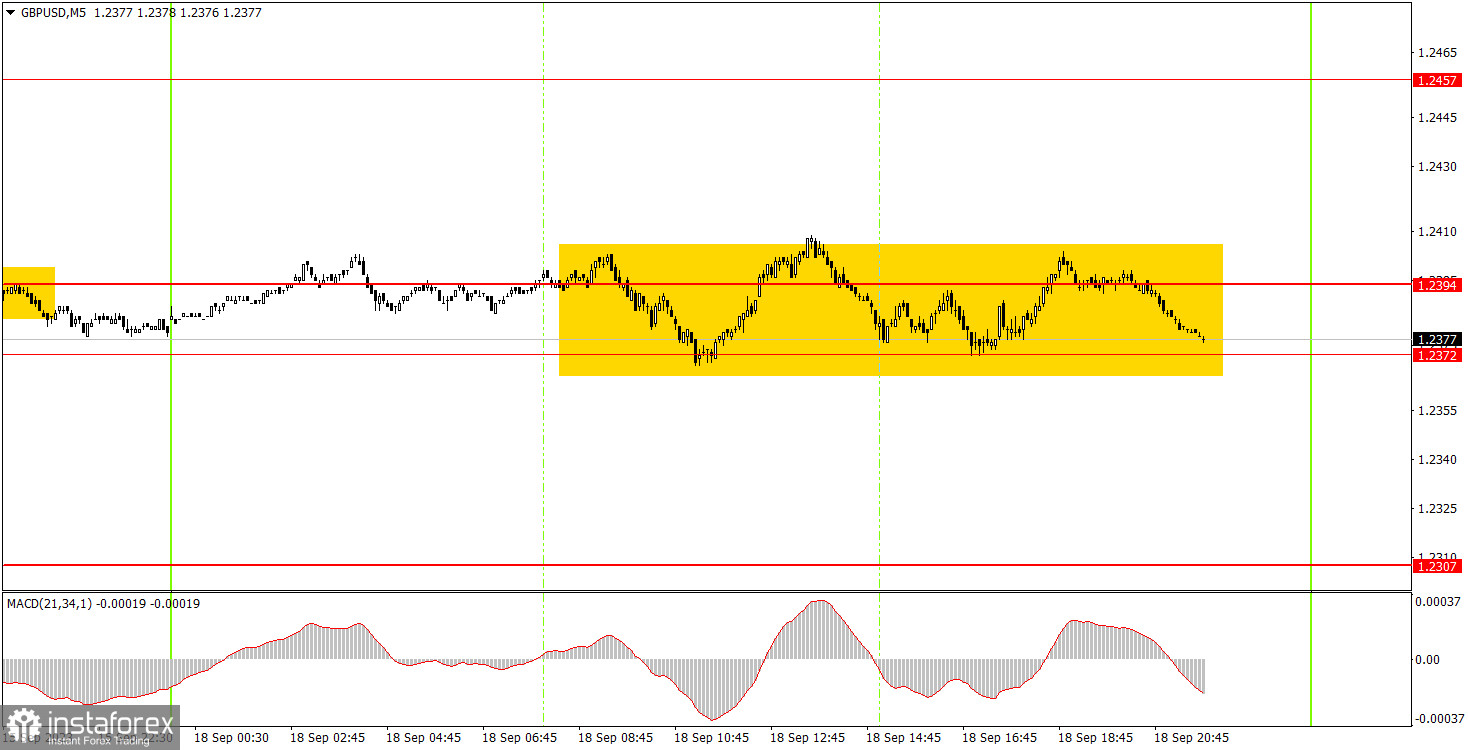
On Monday, the GBP/USD pair was trading flat on the 5-minute timeframe. While one could argue that the price solidified itself above the sideways channel of 1.2372-1.2394 thrice (or four times, considering the Asian trading session), was it even worth attempting to trade these signals? If novice traders did venture into a long position, there were no clear exit signals formed. As such, while this trade could have been held indefinitely, it most certainly didn't yield profits. What would be the most probable outcome? A modest loss, fitting for a flat trading day.
On the 30-minute timeframe, the GBP/USD pair has concluded an utterly indecipherable correction and seems to be back on its downward trend. The movement we've long anticipated is currently underway, and, for now, it's unclear what might halt its progression. Given this week's potent fundamental backdrop, another correction is possible, but it's challenging to envision a robust uptick for the sterling. On the 5-minute chart tomorrow, the key levels are: 1.2245, 1.2307, 1.2372-1.2394, 1.2457-1.2488, 1.2544, 1.2605-1.2620, 1.2653, 1.2688, 1.2748, and 1.2787-1.2791. If the price moves 20 points in the intended direction post-trade initiation, consider setting a break-even Stop Loss. On Tuesday, the UK calendar is devoid of any major events, while the US is slated for a secondary report on building permits issuance. It's been a while since this report triggered any significant market response. A mere 20-30 point reaction is virtually inconsequential.
1) Signal strength is determined by the time taken for its formation (either a bounce or level breach). A shorter formation time indicates a stronger signal.
2) If two or more trades around a certain level are initiated based on false signals, subsequent signals from that level should be disregarded.
3) In a flat market, any currency pair can produce multiple false signals or none at all. In any case, the flat trend is not the best condition for trading.
4) Trading activities are confined between the onset of the European session and mid-way through the U.S. session, post which all open trades should be manually closed.
5) On the 30-minute timeframe, trades based on MACD signals are only advisable amidst substantial volatility and an established trend, confirmed either by a trend line or trend channel.
6) If two levels lie closely together (ranging from 5 to 15 pips apart), they should be considered as a support or resistance zone.
Support and Resistance price levels can serve as targets when buying or selling. You can place Take Profit levels near them.
Red lines represent channels or trend lines, depicting the current market trend and indicating the preferable trading direction.
The MACD (14,22,3) indicator, encompassing both the histogram and signal line, acts as an auxiliary tool and can also be used as a signal source.
Significant speeches and reports (always noted in the news calendar) can profoundly influence the price dynamics. Hence, trading during their release calls for heightened caution. It may be reasonable to exit the market to prevent abrupt price reversals against the prevailing trend.
Beginning traders should always remember that not every trade will yield profit. Establishing a clear strategy coupled with sound money management is the cornerstone of sustained trading success.
Le recensioni analitiche di InstaForex ti renderanno pienamente consapevole delle tendenze del mercato! Essendo un cliente InstaForex, ti viene fornito un gran numero di servizi gratuiti per il trading efficiente.


