 Rimani
Condizioni di trading
Strumenti


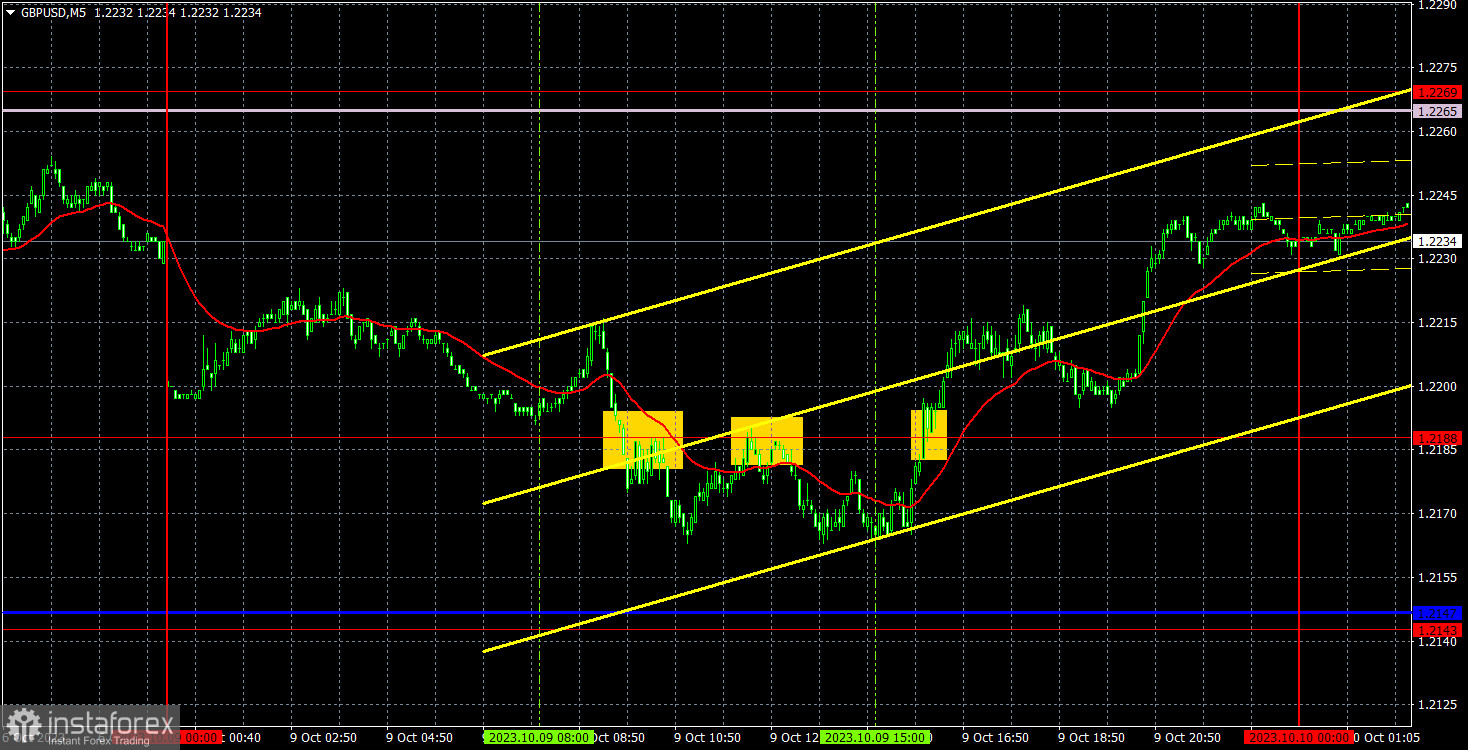
GBP/USD continued to provide slight positive trades on Monday. To be more precise, in the first half of the day, there was a downward retracement against the pair's growth on Friday, and in the second half, the pair corrected higher, which is what we've seen for several days now. There were no significant economic reports or fundamental events on Monday. Of course, the number one issue for the world right now is Israel, but I would like to remind you that military conflicts are ongoing all the time, and it's unlikely that we can expect each one to have an immediate impact on the currency market. Over time, of course, this conflict (if it doesn't end soon) will have a significant impact on the markets, but not at the moment. For now, the pound is focused on its corrective move, and there should be nothing to hinder that.
Three trading signals were formed near the level of 1.2188. The first two signals were for selling and they duplicated each other, so only one short position should have been opened. The price did not fall by 20 pips, so it was not possible to set a stop loss to breakeven, and the trade was closed with a small loss when a buy signal was formed near the same level of 1.2188. After that, the pair managed to rise by about 40 pips, which definitely covered the losses from the first trade. Overall, the movements were quite logical and decent. We expect the pair to continue its bullish correction in the coming days.
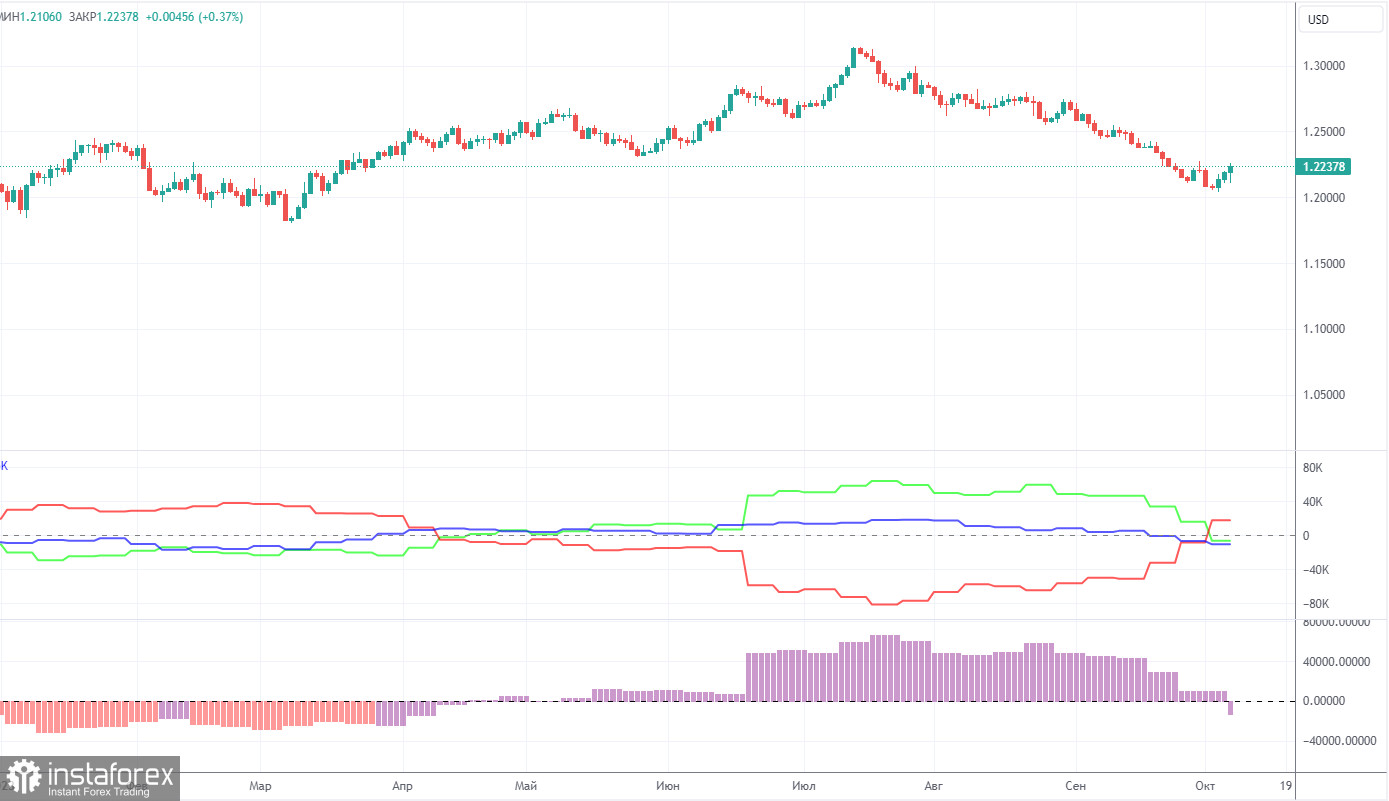
COT reports on the British pound also align perfectly with what's happening in the market. According to the latest report on GBP/USD, the non-commercial group closed 10,800 long positions and opened 11,500 short ones. Thus, the net position of non-commercial traders decreased by another 22,300 contracts in a week. The net position indicator has been steadily rising over the past 12 months, but it has been firmly decreasing over the past two months. The British pound is also losing ground. We have been waiting for many months for the sterling to reverse downwards. Perhaps GBP/USD is at the very beginning of a prolonged downtrend. At least in the coming months, we do not see significant prospects for the pound to rise, and even if we're currently witnessing a corrective phase, it could persist for several months.
The British pound has surged by a total of 2,800 pips from its absolute lows reached last year, which is an enormous increase. Without a strong downward correction, a further upward trend would be entirely illogical (if it is even planned). We don't rule out an extension of an uptrend. We simply believe that a substantial correction is needed first, and then we should assess the factors supporting the US dollar and the British pound. A correction to the level of 1.1844 would be enough to establish a fair equilibrium between the two currencies. The non-commercial group currently holds a total of 73,900 longs and 80,500 shorts. The bears have been holding the upper hand in recent months, and we believe this trend will continue in the near future.
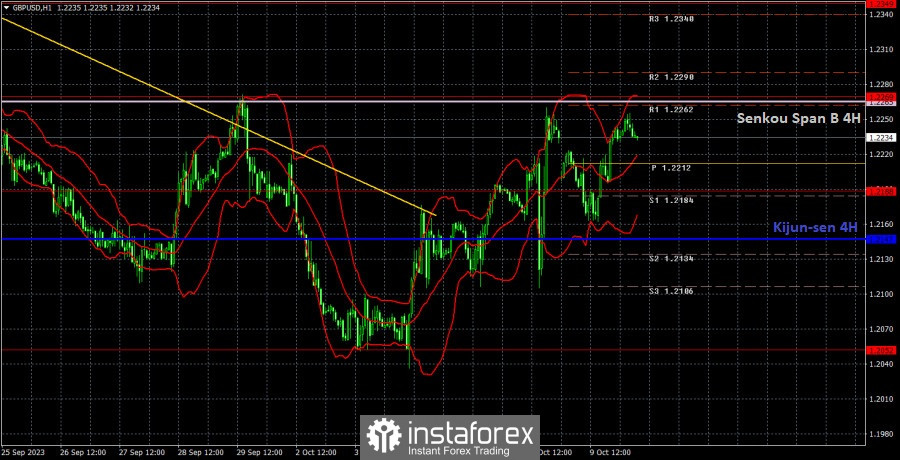
On the 1H chart, GBP/USD quickly ended its long-awaited bullish correction but has already started a new one. The pound, as before, is poised to go downward. So, we do not believe that its decline in 2023 is over. The only thing is that we would have preferred to see a stronger correction than what we have now. In order to do so, the price needs to climb above the Senkou Span B line. However, failing to overcome this line could easily bring back the downtrend, which would be a strong signal not to ignore.
As of October 10, we highlight the following important levels: 1.1760, 1.1874, 1.1927-1.1965, 1.2052, 1.2188, 1.2269, 1.2349, 1.2429-1.2445, 1.2520, 1.2605-1.2620, 1.2693. The Senkou Span B (1.2265) and Kijun-sen (1.2147) lines can also be sources of signals. Signals can be "bounces" and "breakouts" of these levels and lines. It is recommended to set the Stop Loss level to break-even when the price moves in the right direction by 20 pips. The Ichimoku indicator lines can move during the day, which should be taken into account when determining trading signals. The illustration also includes support and resistance levels that can be used to lock in profits from trades.
On Tuesday, no significant or even secondary macroeconomic events are scheduled in either the US or the UK. Federal Reserve officials will speak, but we don't expect the market to react to this event. Currently, the market is uncertain about a Fed rate hike in November, but they could grow more confident after the September inflation report.
Support and resistance levels are thick red lines near which the trend may end. They do not provide trading signals;
The Kijun-sen and Senkou Span B lines are the lines of the Ichimoku indicator, plotted to the 1H timeframe from the 4H one. They provide trading signals;
Extreme levels are thin red lines from which the price bounced earlier. They provide trading signals;
Yellow lines are trend lines, trend channels, and any other technical patterns;
Indicator 1 on the COT charts is the net position size for each category of traders;
Indicator 2 on the COT charts is the net position size for the Non-commercial group.
Le recensioni analitiche di InstaForex ti renderanno pienamente consapevole delle tendenze del mercato! Essendo un cliente InstaForex, ti viene fornito un gran numero di servizi gratuiti per il trading efficiente.


