 Rimani
Condizioni di trading
Strumenti


EUR/USD experienced a significant surge on Tuesday. As we have mentioned in previous articles, it was particularly triggered by the U.S. inflation data, and it's hard to say that it is resonant. We would understand if the inflation value for October deviated by 0.5% below forecasts. However, both the core and overall inflation only deviated by 0.1% from the consensus estimates. It remains unclear as to what caused such a strong market reaction. What is apparent is that after yesterday's report, the chances of another Federal Reserve rate hike has dropped practically to zero. In the last three months, inflation has been rising, but now it has nearly returned to the lowest value in the current slowdown cycle. Therefore, there is simply no need for the Fed to implement additional tightening at this time. This is why the dollar fell, but in our opinion, the dollar did not deserve such a deep decline.
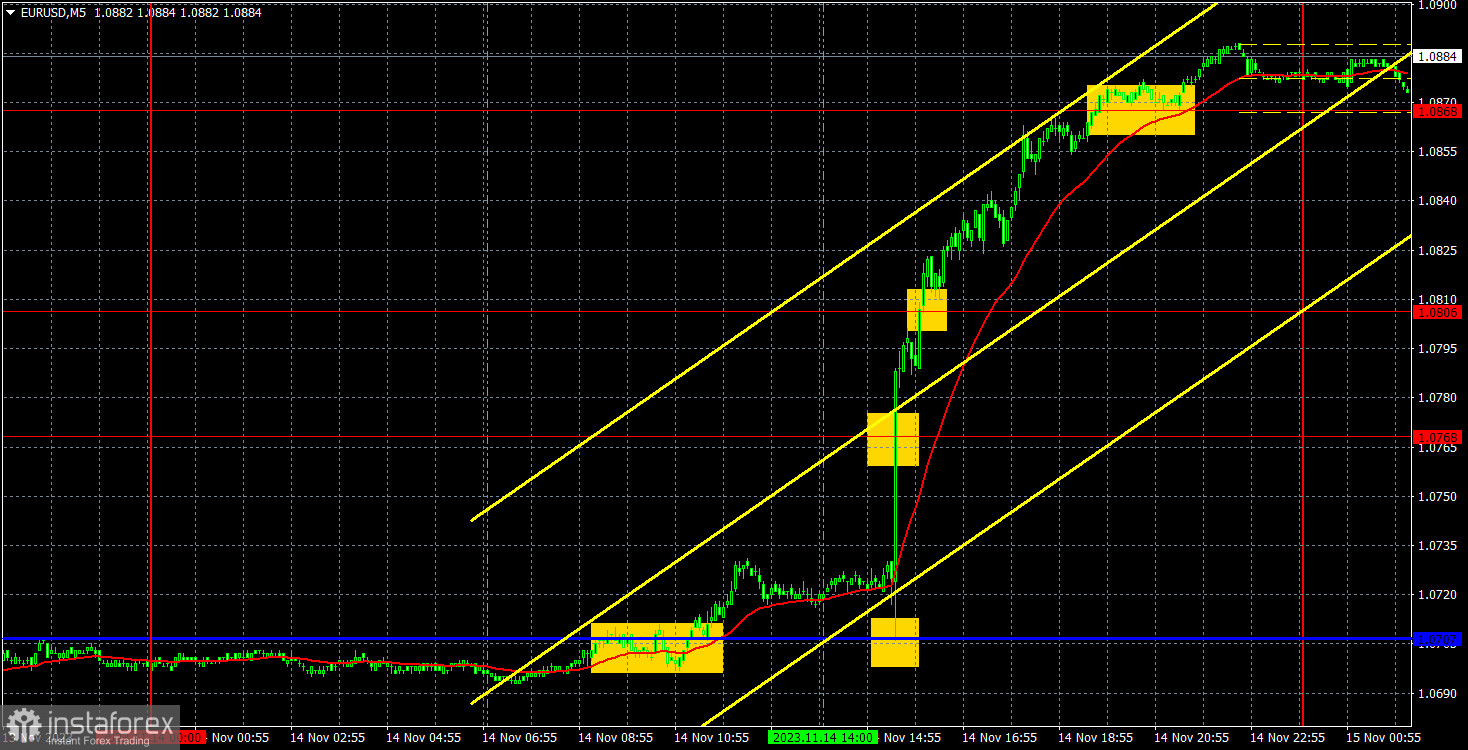
Speaking of trading signals, traders were lucky on Tuesday. It is clear that during and after the release of the inflation data, one should not have tried to enter the market, as no one could predict the strength of the movement. Such movements, like yesterday's, happen several times a year. However, a buy signal formed near the critical line during the European trading session, and it needed to be executed. Then, when the inflation data was released, traders just needed to set the Stop Loss to breakeven (or below the critical line) and hope for the pair's growth. The pair did rise, and the price reached the level of 1.0868 and even surpassed it. Long positions should have been closed around this level. The profit was at least 150 pips.
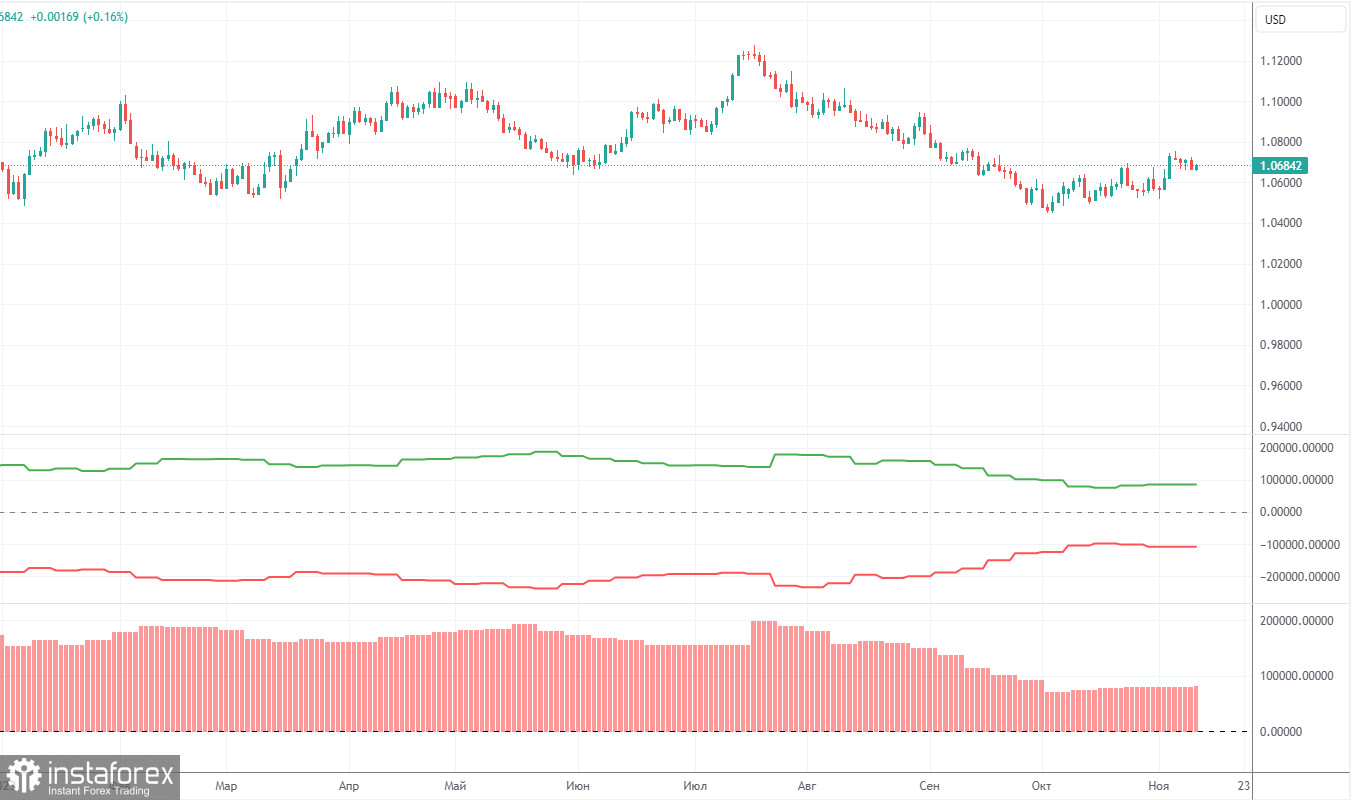
On Friday, a new COT report for October 31st was released. Over the past 12 months, the COT report data has been consistent with what's happening in the market. The net position of large traders (the second indicator) began to rise back in September 2022, roughly at the same time that the euro started to rise. In the first half of 2023, the net position hardly increased, but the euro remained relatively high during this period. Only in the last three months, we have seen a decline in the euro and a drop in the net position, as we anticipated. Currently, the net position of non-commercial traders is still bullish and this trend is likely to lose momentum soon.
We have previously noted that the red and green lines have moved significantly apart from each other, which often precedes the end of a trend. This configuration persisted for over half a year, but ultimately, the lines have started moving closer to each other. Therefore, we still stick to the scenario that the upward trend is over. During the last reporting week, the number of long positions for the "non-commercial" group decreased by 4,700, while the number of short positions fell by 4,800. Consequently, the net position remained mostly unchanged. The number of BUY contracts is still higher than the number of SELL contracts among non-commercial traders by 82,000, but the gap is narrowing. In principle, it is now evident even without COT reports that the euro is set to extend its weakness. However, the corrective phase has not yet ended.
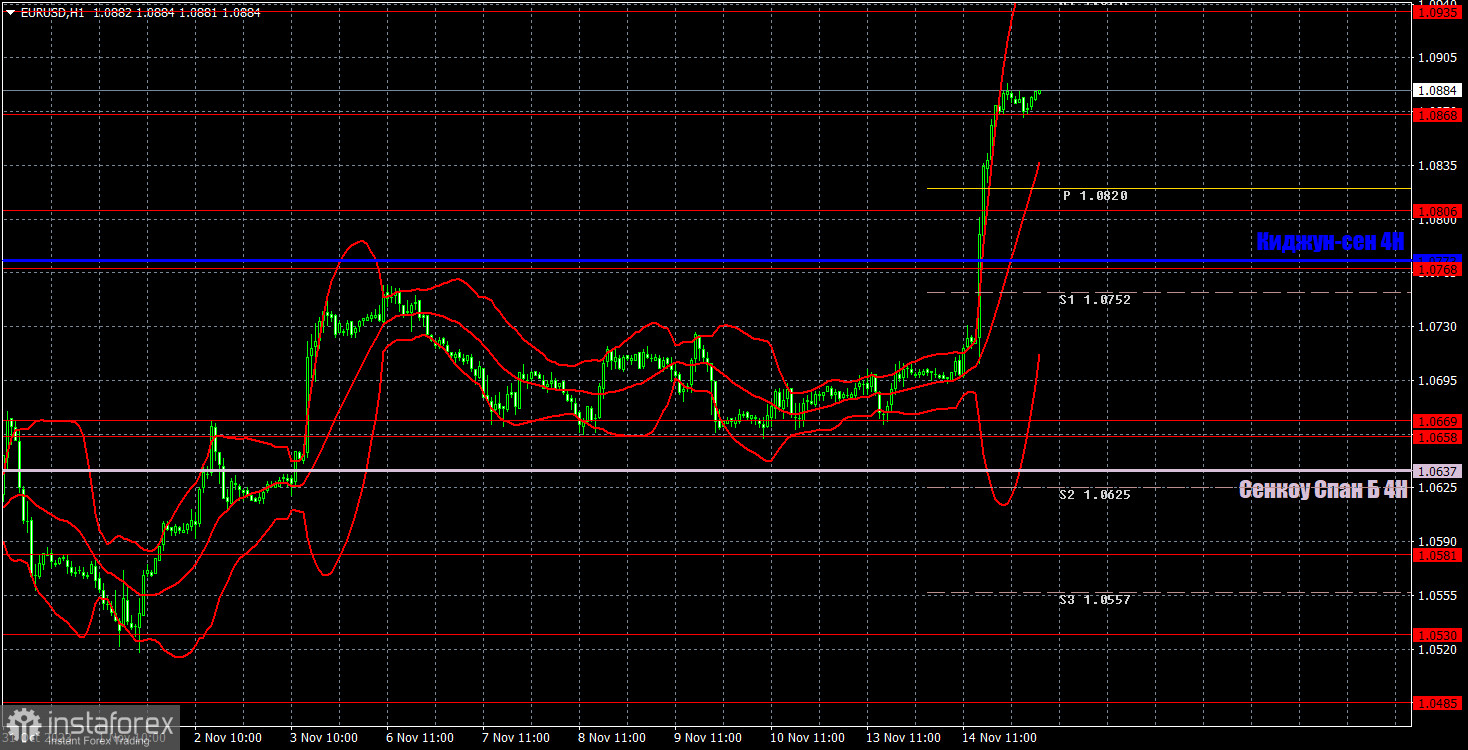
On the 1-hour chart, the pair exhibited another corrective phase. Two out of the five phases in the current correction were triggered by weak U.S. reports. Therefore, for now, we can say that reports have been boosting the euro, U.S. data in particular, as the eurozone reports have been weak. For now, we need to wait for the pair to breach the Senkou Span B and Kijun-sen lines in order to identify the recommencement of the downtrend in the medium-term.
On November 15, we highlight the following levels for trading: 1.0485, 1.0530, 1.0581, 1.0658-1.0669, 1.0768, 1.0806, 1.0868, 1.0935, 1.1012, 1.1092, as well as the Senkou Span B (1.0637) and Kijun-sen (1.0772) lines. The Ichimoku indicator lines can shift during the day, so this should be taken into account when identifying trading signals. There are also auxiliary support and resistance levels, but signals are not formed near them. Signals can be "bounces" and "breakouts" of extreme levels and lines. Don't forget to set a breakeven Stop Loss if the price has moved in the right direction by 15 pips. This will protect against potential losses if the signal turns out to be false.
On Wednesday, the EU will publish the industrial production report, and the US will release the retail sales data and the producer price index. All of these reports are secondary of importance, so today's movements will be much weaker than yesterday. We expect a downward pullback.
Support and resistance levels are thick red lines near which the trend may end. They do not provide trading signals;
The Kijun-sen and Senkou Span B lines are the lines of the Ichimoku indicator, plotted to the 1H timeframe from the 4H one. They provide trading signals;
Extreme levels are thin red lines from which the price bounced earlier. They provide trading signals;
Yellow lines are trend lines, trend channels, and any other technical patterns;
Indicator 1 on the COT charts is the net position size for each category of traders;
Indicator 2 on the COT charts is the net position size for the Non-commercial group.
Le recensioni analitiche di InstaForex ti renderanno pienamente consapevole delle tendenze del mercato! Essendo un cliente InstaForex, ti viene fornito un gran numero di servizi gratuiti per il trading efficiente.


