 Rimani
Condizioni di trading
Strumenti


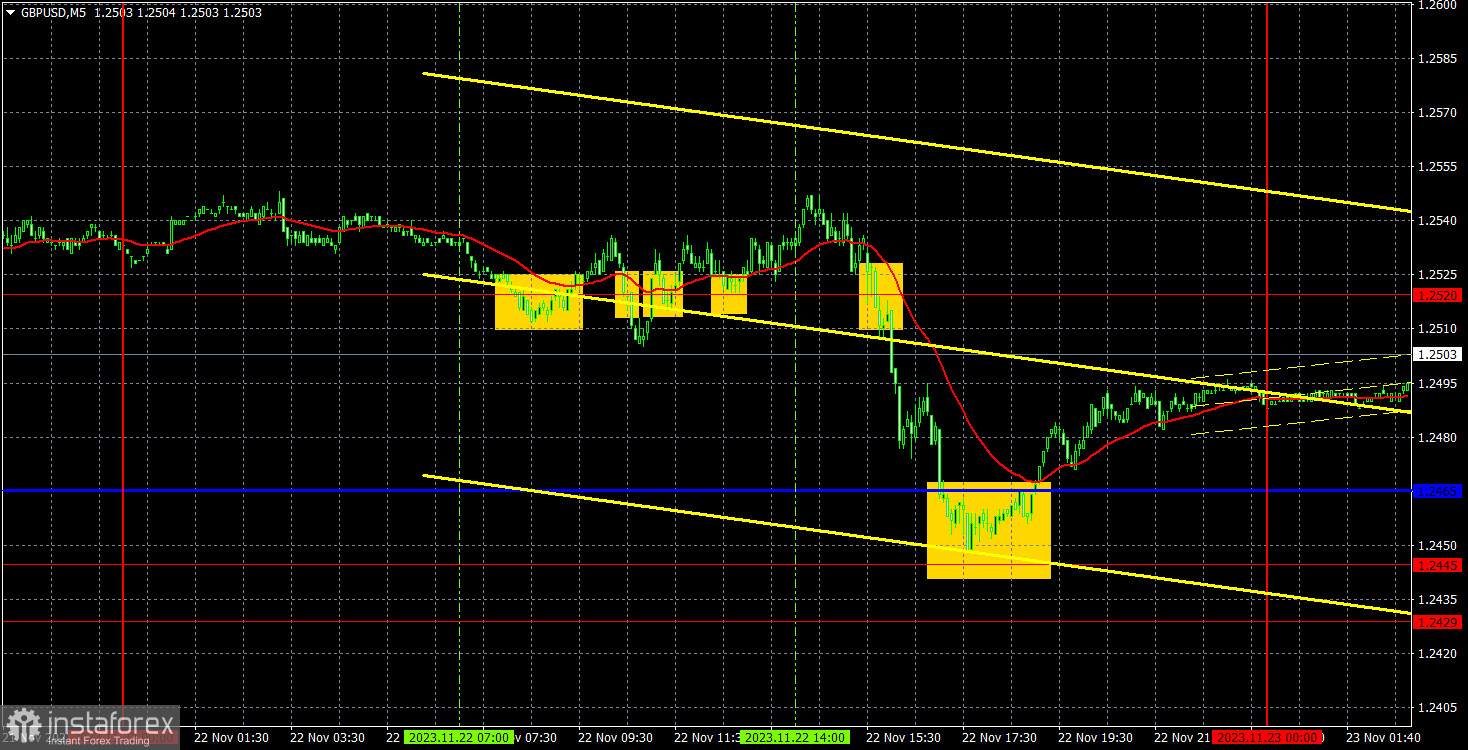
GBP/USD also experienced a minor downward correction on Wednesday, while overall volatility reached 100 pips. This is already something to talk about. Unfortunately, during the European session, movements left much to be desired. In general, we witnessed a flat, and the pair only started to move normally during the U.S. session when three more or less significant reports were published in America. As we mentioned before, reports on durable goods orders and the University of Michigan's consumer sentiment turned out to be weaker than expected. However, the third report on initial jobless claims was better than the market's expectations. In our opinion, one positive report could not outweigh two negatives, so we believe that the British pound fell on Wednesday due to the pair's overbought condition.
Speaking of trading signals, the flat condition during the European session did not bring any profit. During the first half of the day, four signals were formed around the level of 1.2520, and they were all false signals because the pair, essentially, stood still. Therefore, when the fifth signal was formed around the level of 1.2520 during the U.S. session, it should not have been executed. And the best movement of the day began at this time. Traders could open 1-2 trades in the morning, incurring a small loss, and could then work out the rebound from the level of 1.2445, which allowed them to offset this loss. However, there was no substantial profit
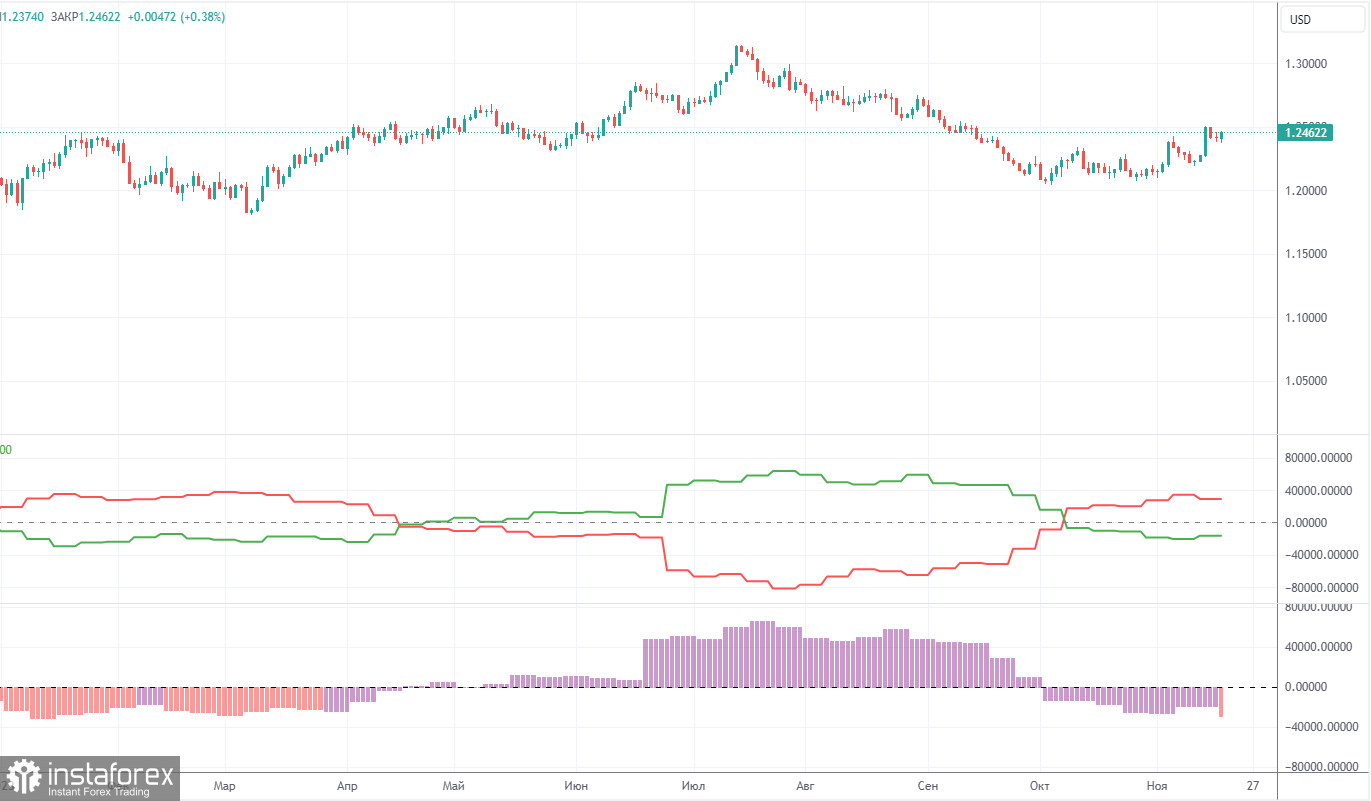
COT reports on the British pound also align perfectly with what's happening in the market. According to the latest report on GBP/USD, the non-commercial group closed 6,100 long positions and 10,200 short ones. Thus, the net position of non-commercial traders decreased by another 4,100 contracts in a week. The net position indicator has been steadily rising over the past 12 months, but it has been firmly decreasing over the past three months. The British pound is also losing ground. We have been waiting for many months for the sterling to reverse downwards. Perhaps GBP/USD is at the very beginning of a prolonged downtrend or in the middle of a strong correction. At least in the coming months, we do not see significant prospects for the pound to rise, and even if we're currently witnessing a corrective phase, it could persist for quite some time.
The British pound has surged by a total of 2,800 pips from its absolute lows reached last year, which is an enormous increase. Without a strong downward correction, a further upward trend would be entirely illogical (if it is even planned). We don't rule out an extension of an uptrend. We simply believe that a substantial correction is needed first, and then we should assess the factors supporting the US dollar and the British pound. A correction to the level of 1.1844 would be enough to establish a fair balance between the two currencies. The non-commercial group currently holds a total of 57,500 longs and 73,800 shorts. The bears have been holding the upper hand in recent months, and we believe this trend will continue in the near future.
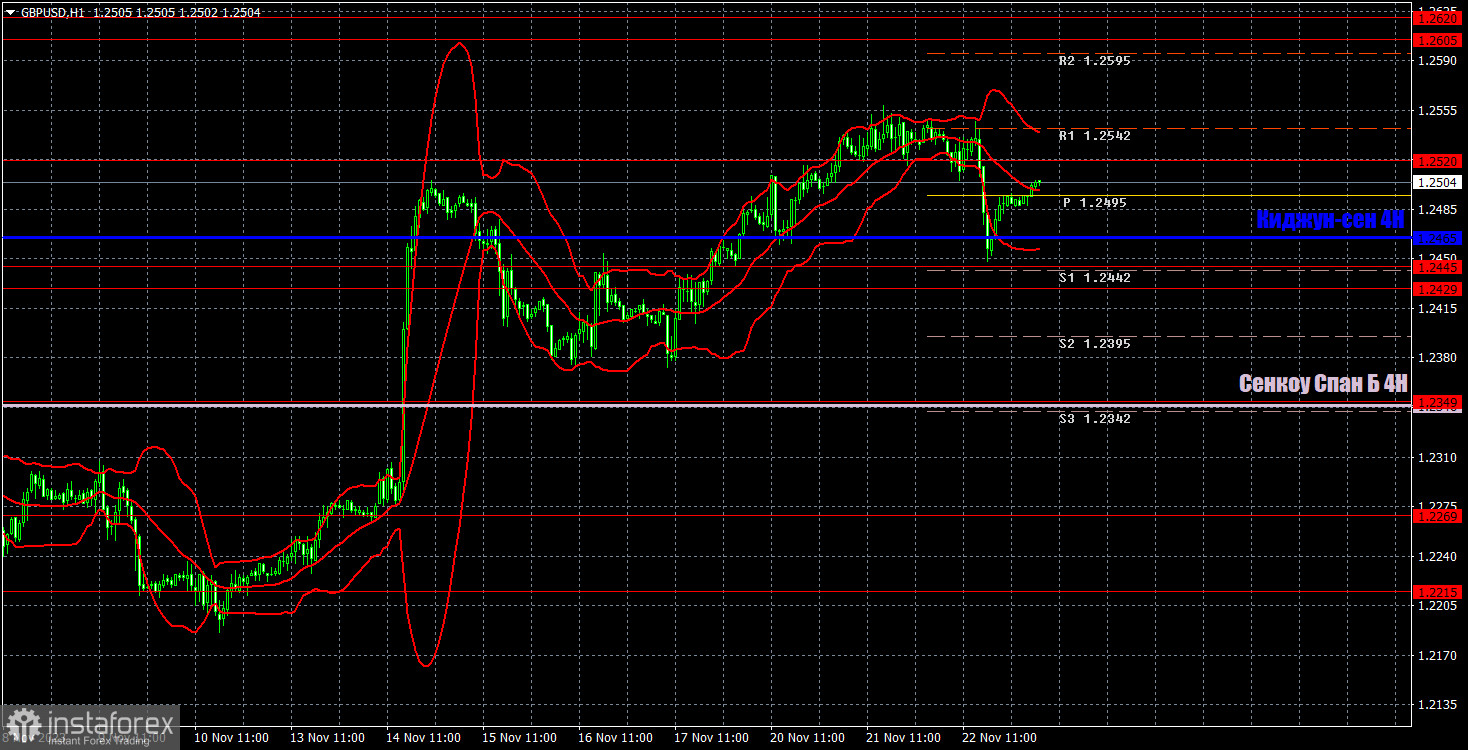
On the 1H chart, GBP/USD continues to form another corrective phase. Last week, it failed to surpass the Kijun-sen line, so there are no technical reasons for the pair to fall. On the contrary, the market indicates that despite the fundamental background and the corrective status of the movement, it is actually ready to buy. Therefore, in our opinion, the current upward movement lacks a solid foundation. However, traders have no choice but to follow the market, follow the trend, and consider buying.
As of November 23, we highlight the following important levels: 1.1927-1.1965, 1.2052, 1.2109, 1.2215, 1.2269, 1.2349, 1.2429-1.2445, 1.2520, 1.2605-1.2620, 1.2693, 1.2786. Senkou Span B (1.2347) and Kijun-sen (1.2465) lines can also be sources of signals. Signals can be "bounces" and "breakouts" of these levels and lines. It is recommended to set the Stop Loss level to break-even when the price moves in the right direction by 20 pips. The Ichimoku indicator lines can move during the day, which should be taken into account when determining trading signals. The illustration also includes support and resistance levels that can be used to lock in profits from trades.
In the UK, the service and manufacturing PMI data for November will be released on Thursday. The US event calendar is empty. However, the pair can still move actively during the US session.
Support and resistance levels are thick red lines near which the trend may end. They do not provide trading signals;
The Kijun-sen and Senkou Span B lines are the lines of the Ichimoku indicator, plotted to the 1H timeframe from the 4H one. They provide trading signals;
Extreme levels are thin red lines from which the price bounced earlier. They provide trading signals;
Yellow lines are trend lines, trend channels, and any other technical patterns;
Indicator 1 on the COT charts is the net position size for each category of traders;
Indicator 2 on the COT charts is the net position size for the Non-commercial group.
Le recensioni analitiche di InstaForex ti renderanno pienamente consapevole delle tendenze del mercato! Essendo un cliente InstaForex, ti viene fornito un gran numero di servizi gratuiti per il trading efficiente.


