 Rimani
Condizioni di trading
Strumenti


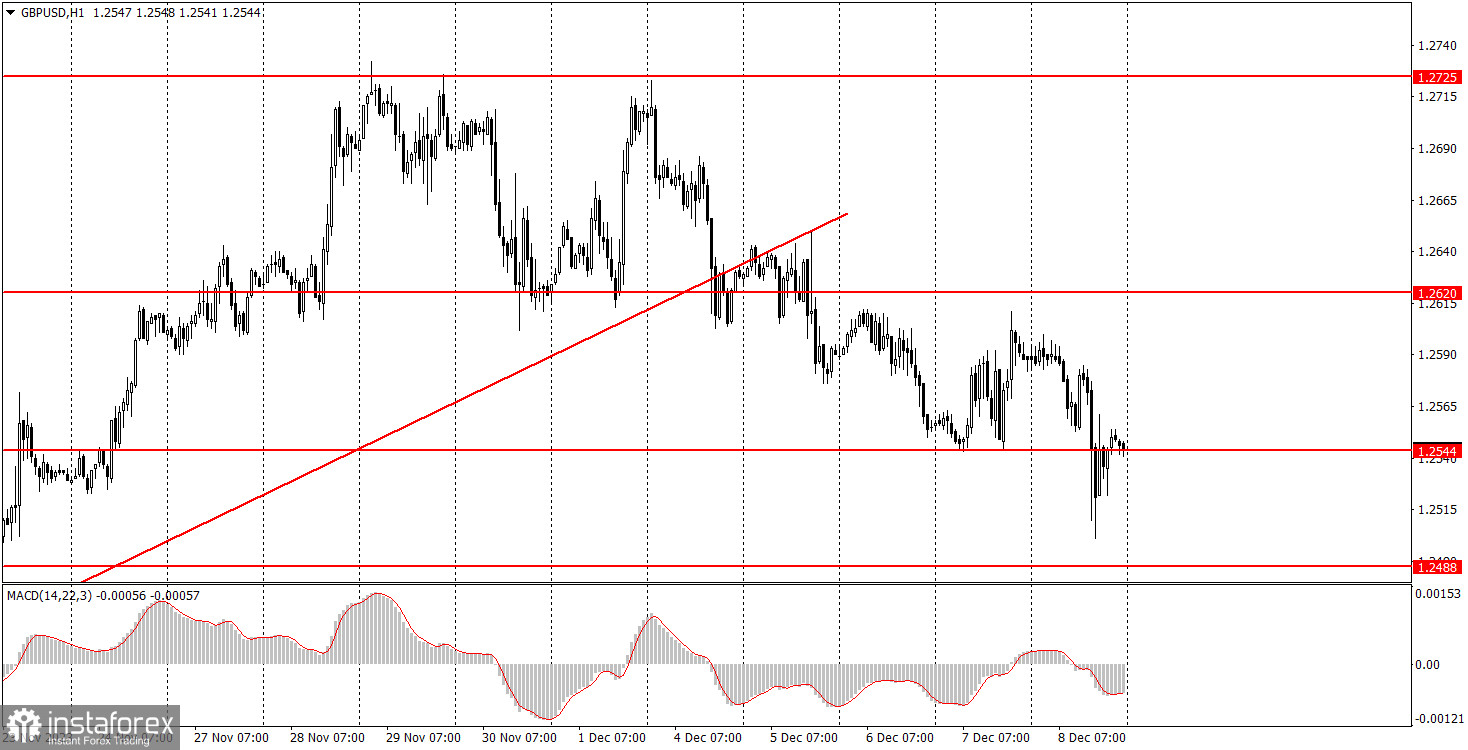
GBP/USD also continued to trade lower. This was due to the reports on the US labor market and unemployment, which turned out better than consensus estimates. Take note that the pound is still falling much more weakly than the euro, but at least it is still falling. And this is what we expect from the pound (a much stronger one than now). The pair overcame the ascending trendline, there is no basis for a new uptrend, and over the past few months, the pair has risen enough to now resume its downtrend. Therefore, we advise you to consider selling the pair.
This week, the Federal Reserve and the Bank of England are about to host their meetings, and a crucial report on US inflation will also be published. There will be other important events and reports. Therefore, we can see quite chaotic, shaky movements with frequent reversals and high volatility. However, all the scheduled reports should not prevent the dollar from rising further.
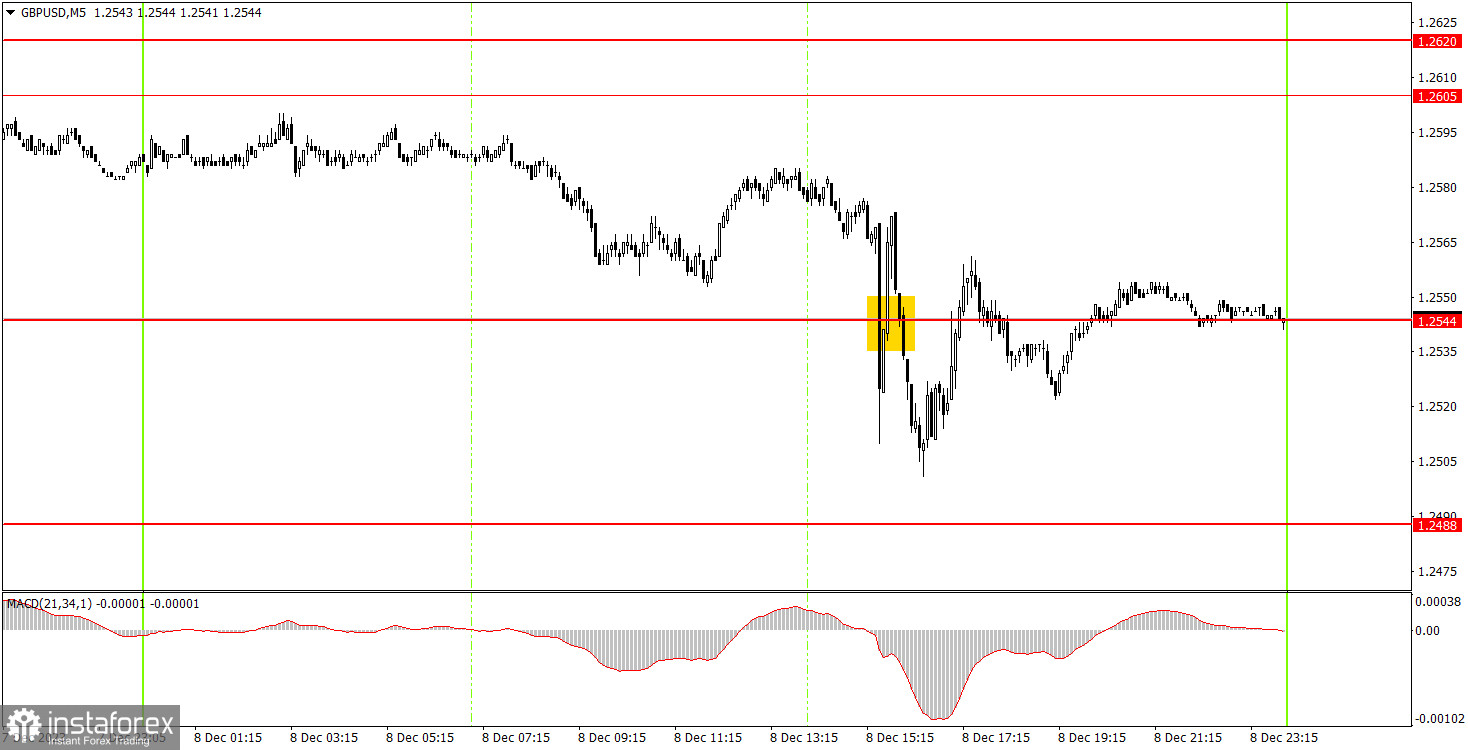
On the 5-minute chart, all the trading signals were generated during the US session. We can look at how the pair fluctuated after the release of US reports: it was dangerous to enter the market, and signals were forming so quickly that there was no opportunity to execute them. As often happens, the market reacted to the news in a panic. The dollar could have strengthened much more, but instead, we saw several impulsive twists of the pair's decline and several upward rebounds.
On the hourly chart, the GBP/USD pair continues its negative trading, which is both weak and uncertain. We believe that the pound should continue to fall as it simply has no fundamental and macroeconomic reason to justify an upward movement. The US reports that were released on Friday did not disappoint, but now the dollar needs to survive the upcoming week with the meetings of the Bank of England and the Federal Reserve, as well as a whole series of important reports.
The key levels on the 5M chart are 1.2270, 1.2310, 1.2372-1.2387, 1.2457-1.2488, 1.2544, 1.2605-1.2620, 1.2688, 1.2723, 1.2787-1.2791, 1.2848-1.2860. On Monday, there are no important events scheduled in either the US or the UK, so we do not expect strong movements or high volatility. In the upcoming week, we can look forward to a huge number of important events that the market will definitely respond to.
1) Signal strength is determined by the time taken for its formation (either a bounce or level breach). A shorter formation time indicates a stronger signal.
2) If two or more trades around a certain level are initiated based on false signals, subsequent signals from that level should be disregarded.
3) In a flat market, any currency pair can produce multiple false signals or none at all. In any case, the flat trend is not the best condition for trading.
4) Trading activities are confined between the onset of the European session and mid-way through the U.S. session, after which all open trades should be manually closed.
5) On the 30-minute timeframe, trades based on MACD signals are only advisable amidst substantial volatility and an established trend, confirmed either by a trendline or trend channel.
6) If two levels lie closely together (ranging from 5 to 15 pips apart), they should be considered as a support or resistance zone.
Support and Resistance price levels can serve as targets when buying or selling. You can place Take Profit levels near them.
Red lines represent channels or trend lines, depicting the current market trend and indicating the preferable trading direction.
The MACD(14,22,3) indicator, encompassing both the histogram and signal line, acts as an auxiliary tool and can also be used as a signal source.
Significant speeches and reports (always noted in the news calendar) can profoundly influence the price dynamics. Hence, trading during their release calls for heightened caution. It may be reasonable to exit the market to prevent abrupt price reversals against the prevailing trend.
Beginners should always remember that not every trade will yield profit. Establishing a clear strategy coupled with sound money management is the cornerstone of sustained trading success.
Le recensioni analitiche di InstaForex ti renderanno pienamente consapevole delle tendenze del mercato! Essendo un cliente InstaForex, ti viene fornito un gran numero di servizi gratuiti per il trading efficiente.

