 Rimani
Condizioni di trading
Strumenti


GBP/USD continued to trade lower on Tuesday and even settled below the trendline and the critical line. Let's put it this way: the British pound took a step in the right direction. However, it is still unclear what direction this is. According to the current fundamental and macroeconomic background (as well as common sense and logic), the pound should be falling for a long and painful period. However, a 100-pip decline does not guarantee a further decline of 500-600 pips, considering the markets' complete reluctance to sell the pound and buy the dollar. Thus, we have seen only a minor correction so far, and overcoming the trendline does not indicate anything significant as it has a very steep slope, and any pullback would lead to consolidation below it.
Yesterday, the US dollar showed a positive trade, but this was not only due to the US inflation report, which turned out to be stronger than expected. The pair started falling in the morning, which gave us hopes that the market was starting to regain some common sense. In the near future, the British pound may continue to fall towards the Senkou Span B line. In the remaining days of the week, there are no important events scheduled in both the US and the UK. We believe that the latest inflation report was enough for the market to realize that the Fed may lower the interest rate much later than June.
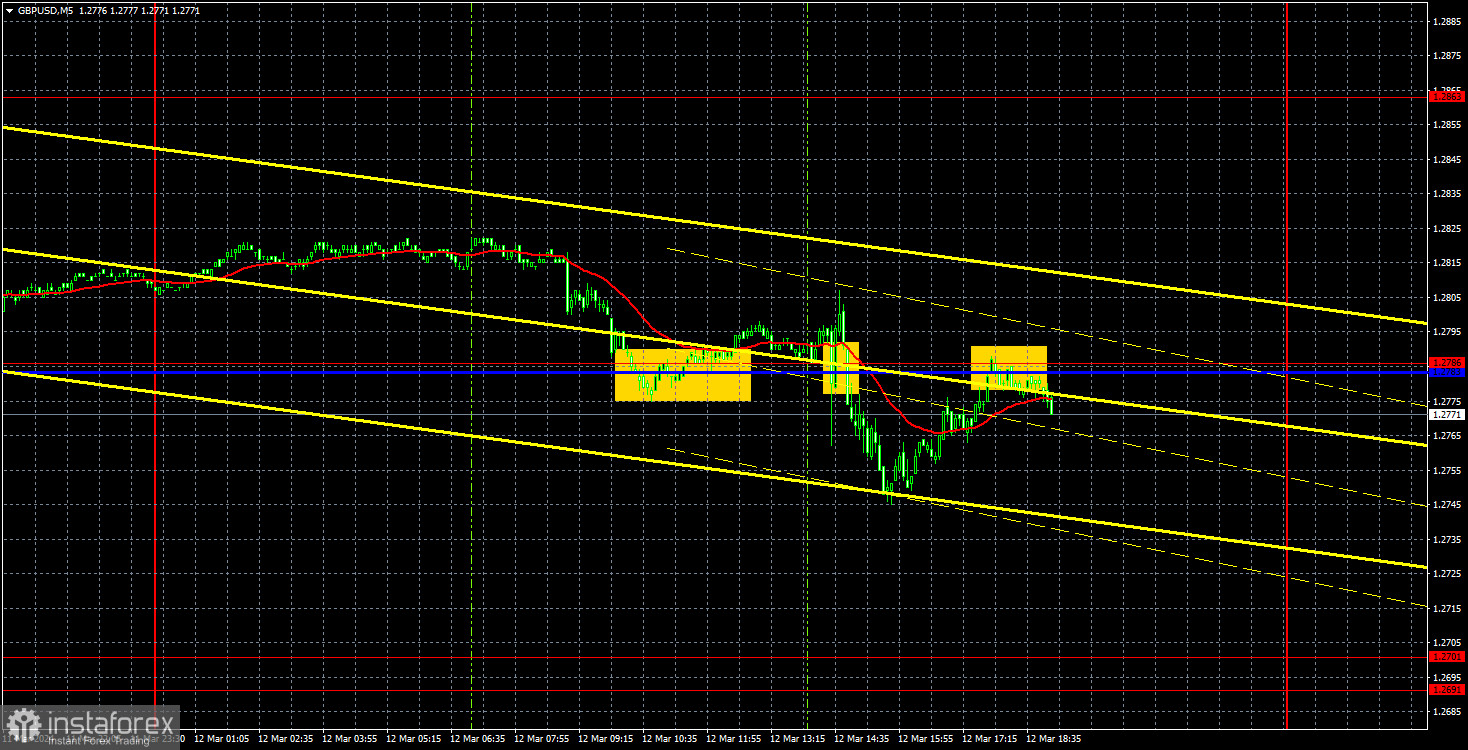
Two trading signals were formed on the 5-minute timeframe, both of which left much to be desired. Initially, the pair rebounded somewhat inaccurately from the Kijun-sen line, but it was better to exit the long position before the release of the inflation report. Then the price consolidated below the Kijun-sen line, and you could consider short positions. However, the pair only fell for a short period, and by the evening, the quotes were near the critical line again.
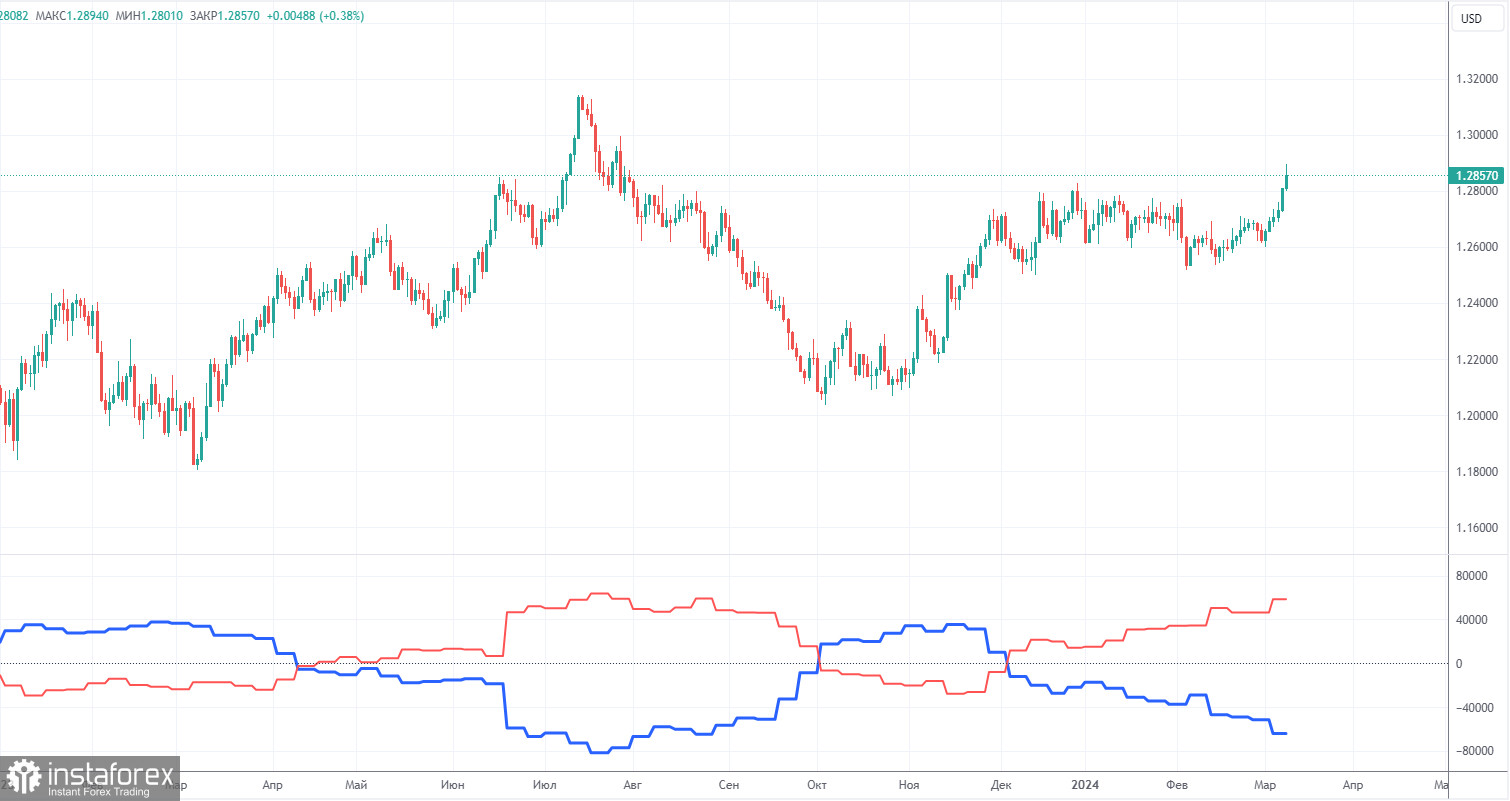
COT reports on the British pound show that the sentiment of commercial traders has frequently changed in recent months. The red and blue lines, which represent the net positions of commercial and non-commercial traders, constantly intersect and, in most cases, remain close to the zero mark. According to the latest report on the British pound, the non-commercial group opened 10,300 buy contracts and closed 1,700 short ones. As a result, the net position of non-commercial traders increased by 12,000 contracts in a week. Despite the fact that the net position of speculators is growing, the fundamental background still does not provide a basis for long-term purchases of the pound sterling.
The non-commercial group currently has a total of 102,000 buy contracts and 43,900 sell contracts. The bulls have a big advantage. However, in recent months, we have repeatedly encountered the same situation: the net position either increases or decreases, the bulls or the bears either have the advantage. Since the COT reports do not provide an accurate forecast of the market's behavior at the moment, we have to scrutinize the technical picture and economic reports. The technical analysis suggests that there's a possibility that the pound could show a pronounced downward movement, but there is currently no sell signal on any timeframe.
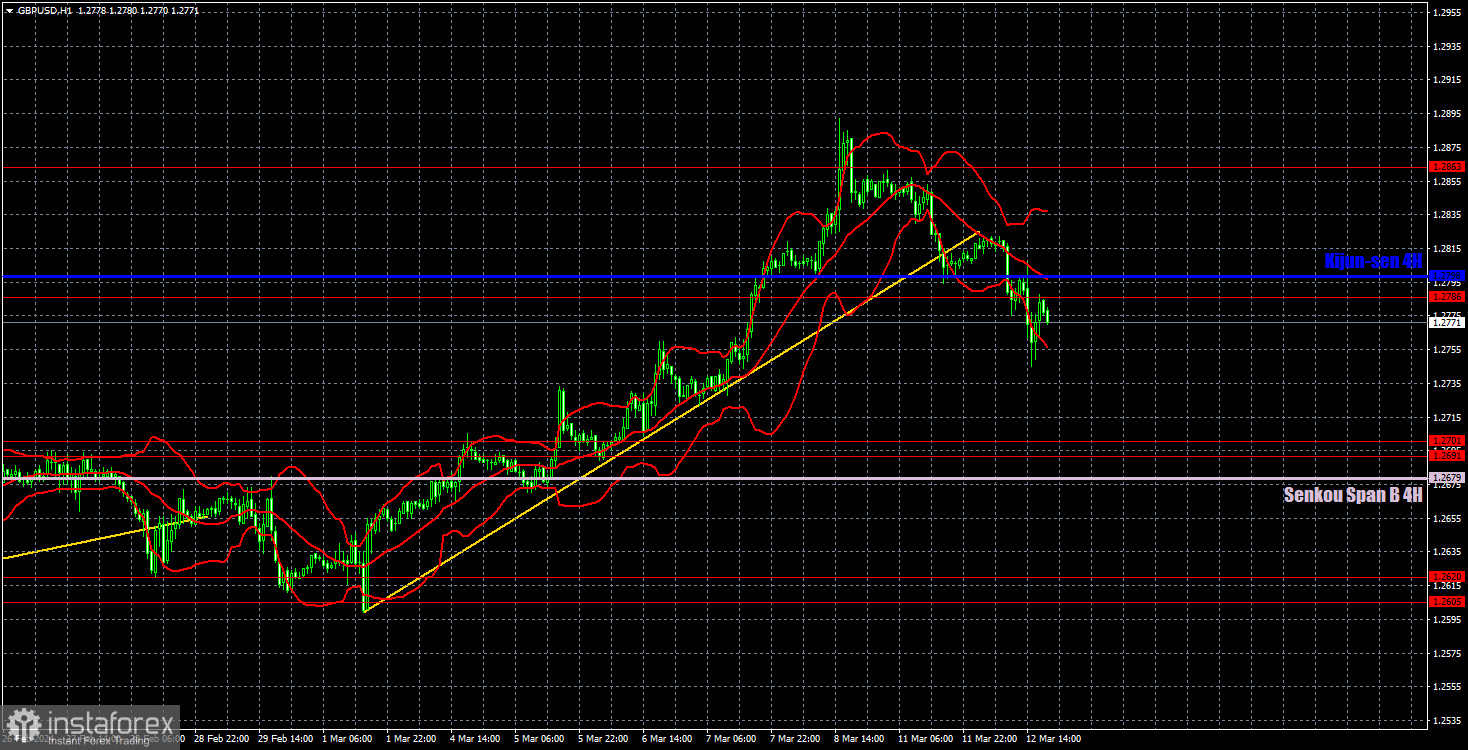
On the 1H chart, GBP/USD resumed the uptrend after a three-month flat period. The economic reports and the fundamental background do not support the British pound, but we have already seen something similar in the second half of 2023. Back then, the British pound also increased for no apparent reasons. If the price consolidates below the trendline and the Kijun-sen line, we can hope that the dollar may start a small corrective phase. At the very least, we expect the price to fall to the Senkou Span B line.
As of March 13, we highlight the following important levels: 1.2215, 1.2269, 1.2349, 1.2429-1.2445, 1.2516, 1.2605-1.2620, 1.2691, 1.2786, 1.2863, 1.2981-1.2987. The Senkou Span B line (1.2679) and the Kijun-sen line (1.2798) can also serve as sources of signals. Don't forget to set a Stop Loss to breakeven if the price has moved in the intended direction by 20 pips. The Ichimoku indicator lines may move during the day, so this should be taken into account when determining trading signals.
On Wednesday, the UK will release reports on monthly GDP and industrial output. They may only trigger a local market reaction (similar reports caused a 15-pip reaction on Tuesday). The US event calendar is empty. So, apparently, we are in for another "boring day".
Support and resistance levels are thick red lines near which the trend may end. They do not provide trading signals;
The Kijun-sen and Senkou Span B lines are the lines of the Ichimoku indicator, plotted to the 1H timeframe from the 4H one. They provide trading signals;
Extreme levels are thin red lines from which the price bounced earlier. They provide trading signals;
Yellow lines are trend lines, trend channels, and any other technical patterns;
Indicator 1 on the COT charts is the net position size for each category of traders;
Indicator 2 on the COT charts is the net position size for the Non-commercial group.
Le recensioni analitiche di InstaForex ti renderanno pienamente consapevole delle tendenze del mercato! Essendo un cliente InstaForex, ti viene fornito un gran numero di servizi gratuiti per il trading efficiente.

