 Rimani
Condizioni di trading
Strumenti


The GBP/USD pair continued to trade higher on Monday. Take note that the euro remained stagnant, while the British pound had much less reason to rise or show any significant intraday trend. Neither the UK nor the US had any interesting events, so once again the pound showed baseless growth. If a few days ago, the rise could have been attributed to a technical correction, now, the pound is rising in habit just like it did for the last 6-8 months. In other words, it's groundless. If this persists, the downward trend may be forgotten. If this week's US reports turn out weaker than forecasted, there's no doubt that the dollar will fall further.
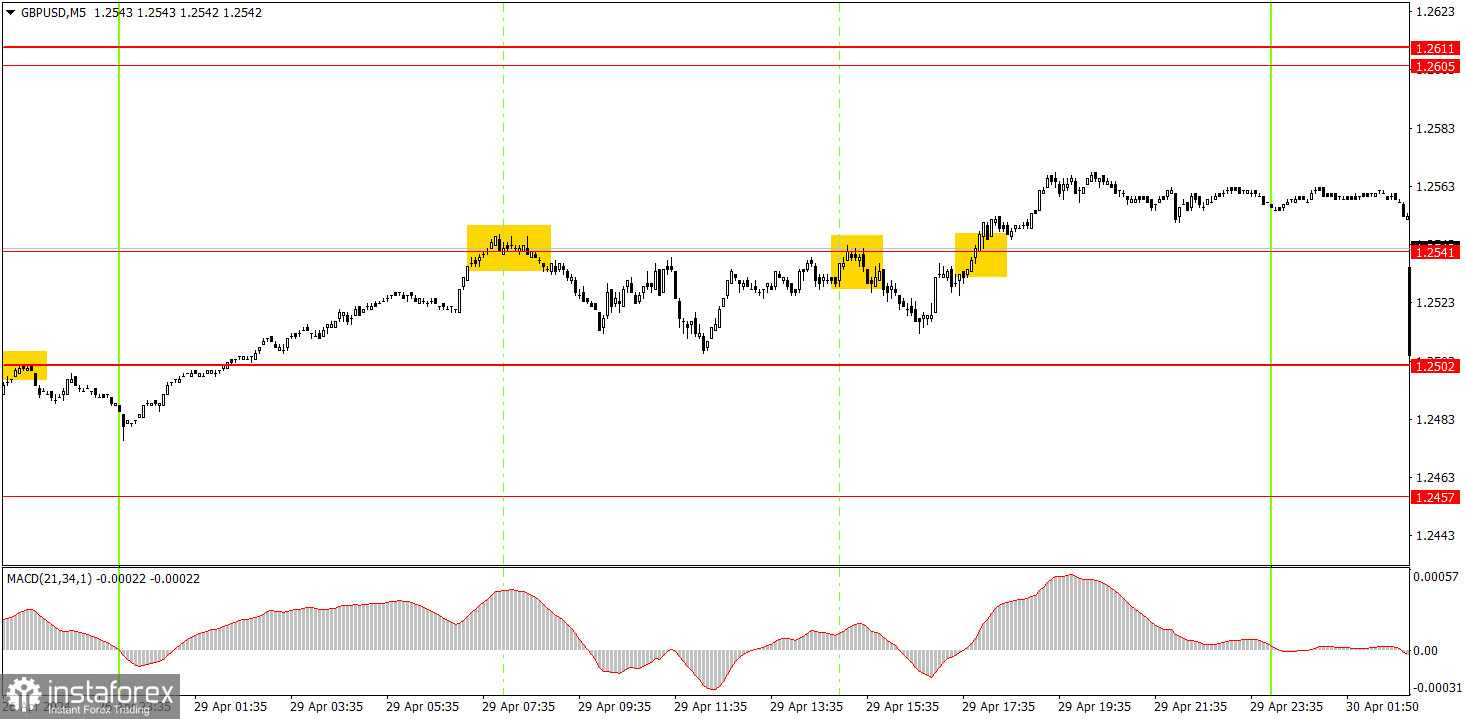
Three trading signals were formed around the level of 1.2541 on the 5-minute timeframe. The price bounced off this level twice and penetrated it once. All signals were clear, but the actual movements left much to be desired. In the first two cases, the price fell by 20 and 15 pips, respectively, while on the buy signal, it rose by 15 pips. Although the pair was not stagnant during the day, it was still challenging to make profit from these movements. The price did not reach the target level in any of these cases.
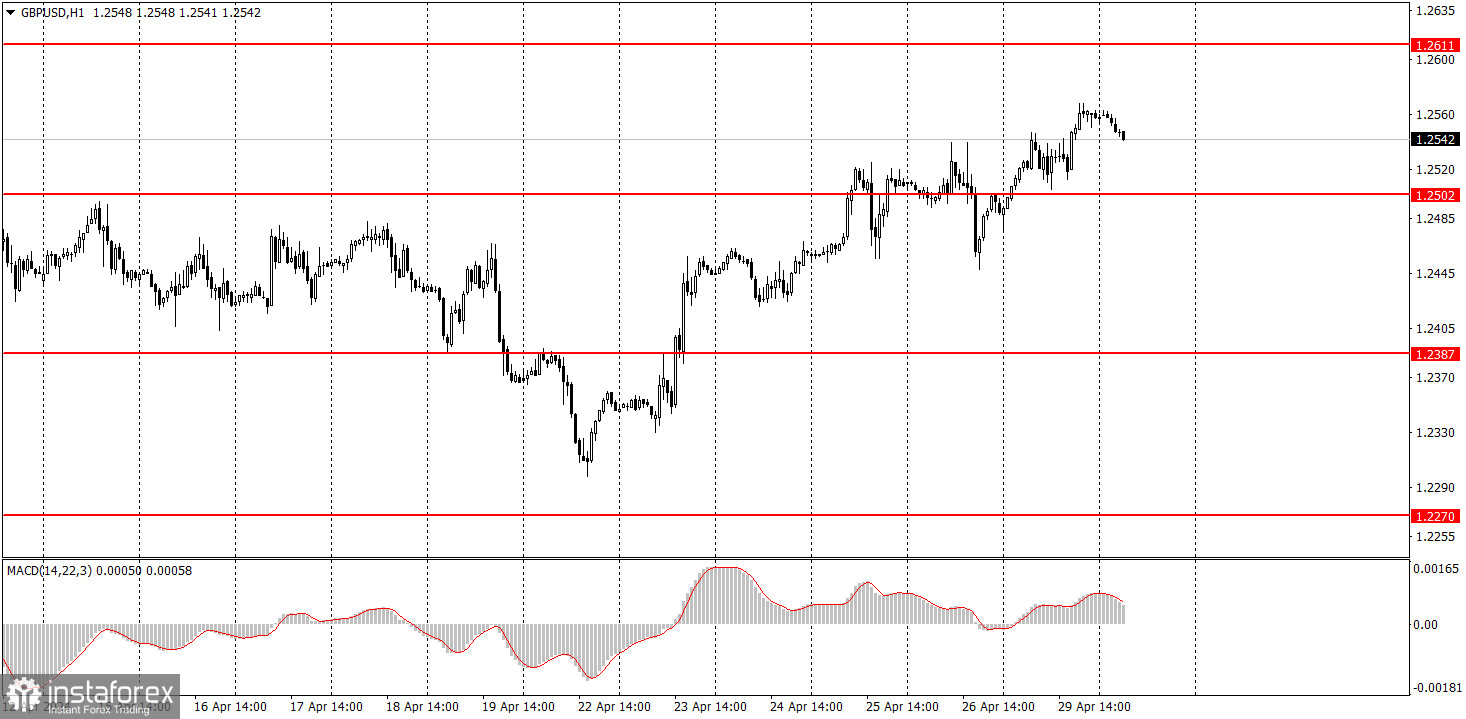
On the hourly chart, the GBP/USD pair has excellent prospects for forming a downward trend, but is currently going through a correction. This corrective phase has been quite strong. The fundamental and macroeconomic backdrop continues to support the dollar much more than the British pound. Therefore, we only expect downward movement from the pair. However, if the market mindlessly buys the pound, then nothing can make the pound fall.
Today, novice traders can look for new sell signals around the level of 1.2541. The market is not in a rush to sell the pair; from a technical standpoint, the upward movement may persist.
The key levels on the 5M chart are 1.2270, 1.2310, 1.2372-1.2387, 1.2457, 1.2502, 1.2544, 1.2605-1.2611, 1.2648, 1.2691, 1.2725, 1.2787-1.2791. On Tuesday, there are no important events scheduled in either the UK or the US. Therefore, traders will have nothing to react to, and volatility may be weak.
1) Signal strength is determined by the time taken for its formation (either a bounce or level breach). A shorter formation time indicates a stronger signal.
2) If two or more trades around a certain level are initiated based on false signals, subsequent signals from that level should be disregarded.
3) In a flat market, any currency pair can produce multiple false signals or none at all. In any case, the flat trend is not the best condition for trading.
4) Trading activities are confined between the onset of the European session and mid-way through the U.S. session, after which all open trades should be manually closed.
5) On the 30-minute timeframe, trades based on MACD signals are only advisable amidst substantial volatility and an established trend, confirmed either by a trendline or trend channel.
6) If two levels lie closely together (ranging from 5 to 15 pips apart), they should be considered as a support or resistance zone.
Support and Resistance price levels can serve as targets when buying or selling. You can place Take Profit levels near them.
Red lines represent channels or trend lines, depicting the current market trend and indicating the preferable trading direction.
The MACD(14,22,3) indicator, encompassing both the histogram and signal line, acts as an auxiliary tool and can also be used as a signal source.
Significant speeches and reports (always noted in the news calendar) can profoundly influence the price dynamics. Hence, trading during their release calls for heightened caution. It may be reasonable to exit the market to prevent abrupt price reversals against the prevailing trend.
Beginners should always remember that not every trade will yield profit. Establishing a clear strategy coupled with sound money management is the cornerstone of sustained trading success.
Le recensioni analitiche di InstaForex ti renderanno pienamente consapevole delle tendenze del mercato! Essendo un cliente InstaForex, ti viene fornito un gran numero di servizi gratuiti per il trading efficiente.

