 Rimani
Condizioni di trading
Strumenti


EUR/USD continued to rise on Monday. The pair remained in a flat range between the levels of 1.0804 and 1.0888 for about two weeks after a one and a half month rally and, as we can see, it failed to correct lower. Therefore, the US dollar continues its illogical decline. Yesterday, the macroeconomic background supported the euro and worked against the dollar. While the S&P business activity indices in the US, Germany, and the European Union were neutral, the US ISM Manufacturing PMI turned out to be much weaker than market expectations, which triggered the dollar sell-off, which continues until now.
Yesterday, we mentioned that the market could interpret any macro data against the dollar. So what can we say about those crucial reports and if they show a value much lower than the forecast? Well, the market has no choice but to sell the dollar. Thus, the upward trend persists, and the dollar continues to fall.
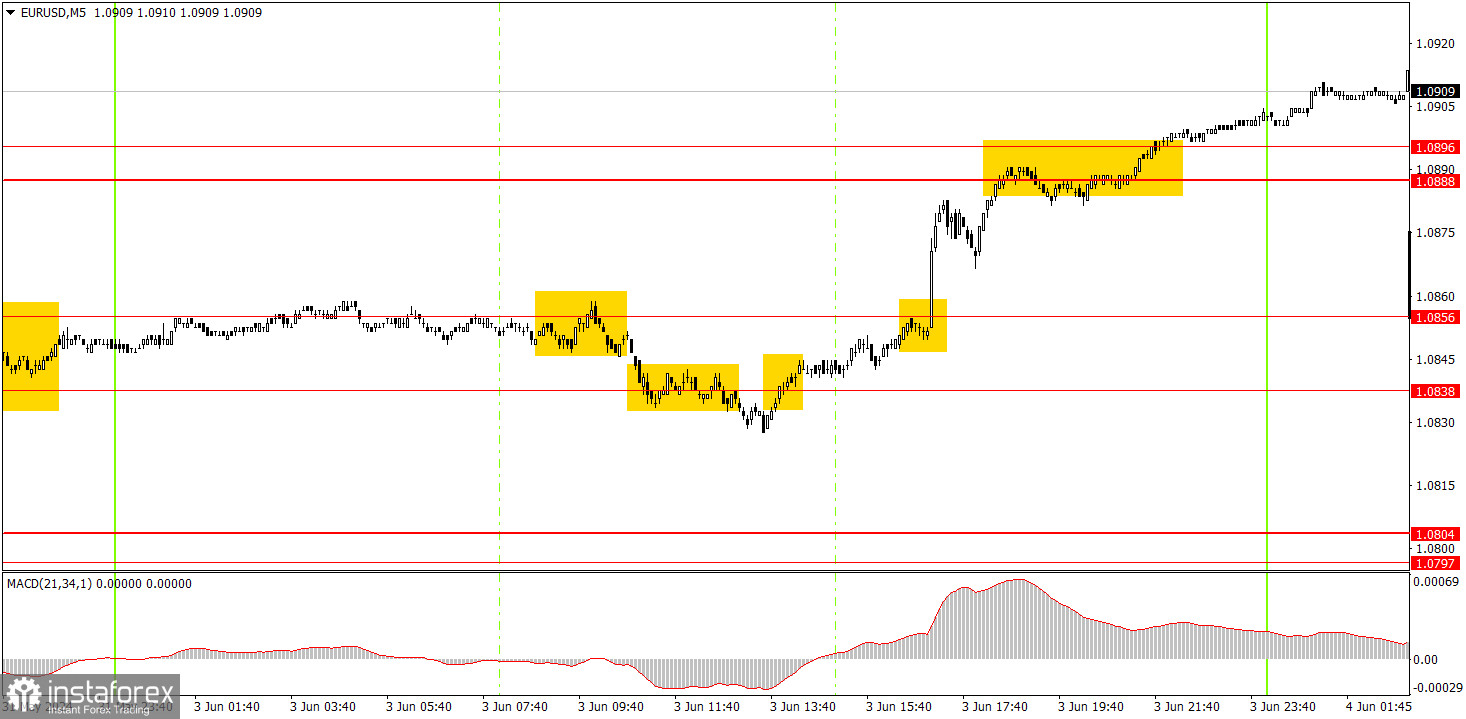
There were quite a few trading signals on the 5-minute timeframe. Initially, traders could open short positions near the level of 1.0856, but the pair only fell for a short time. A buy signal near the level of 1.0838 meant that short positions should be closed, and traders should open long ones. After that, the pair traded upwards, and traders could take profits on long positions in the area of 1.0888-1.0896, a level that the price surpassed. Therefore, technically, beginners could not close the long positions since the pair nearly kept rising...
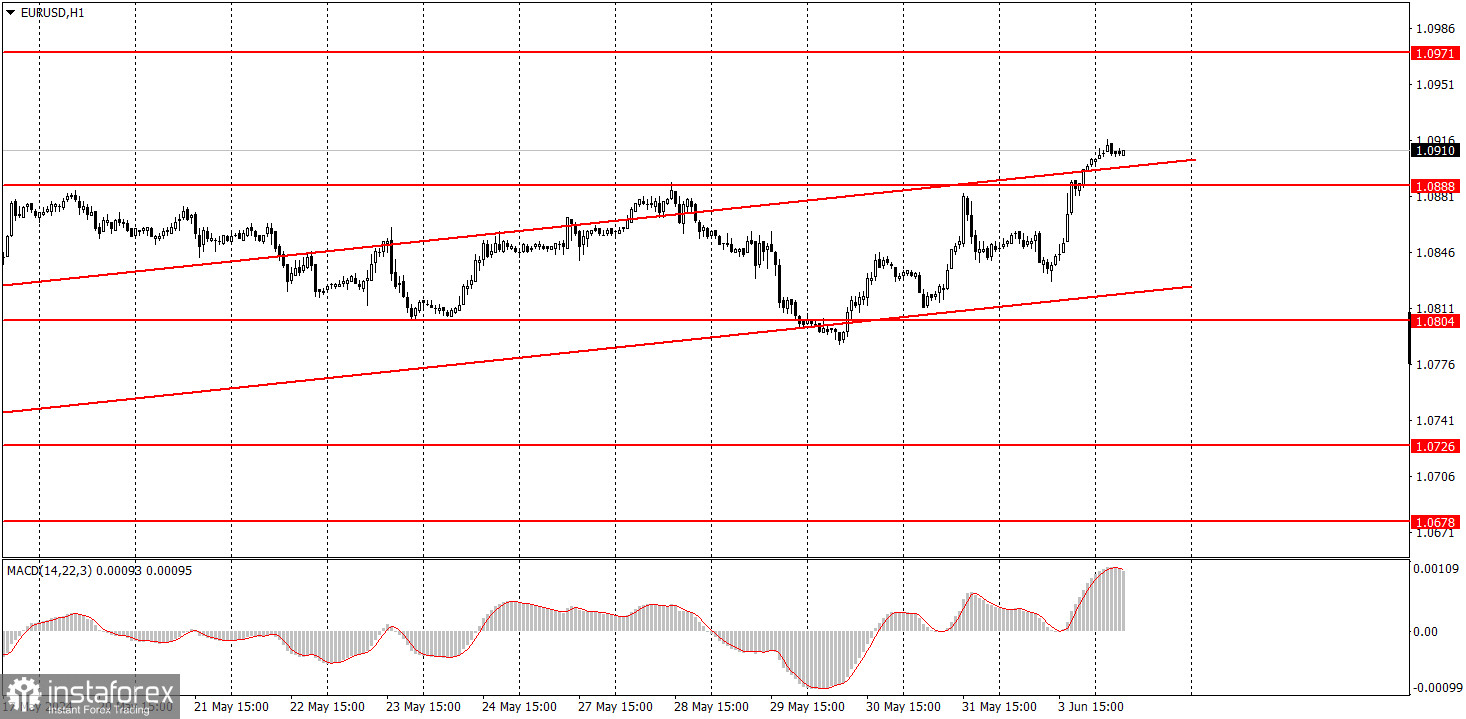
On the hourly chart, the bullish correction remains intact. We still believe that the euro should decline in the medium term, as the overall trend remains downward. However, the market refuses to buy the dollar for unknown reasons and the price can't even break out of the ascending channel. It can't even properly correct lower. A new downward trend may form if the price consolidates below the ascending channel.
On Tuesday, novice traders can stay in long positions after the price consolidates above the range of 1.0888-1.0896. During the day, the pair may slightly retreat, but so far we do not see any signs of the end of the uptrend.
The key levels on the 5M chart are 1.0483, 1.0526, 1.0568, 1.0611, 1.0678, 1.0726-1.0733, 1.0797-1.0804, 1.0838-1.0856, 1.0888-1.0896, 1.0940, 1.0971-1.0981. Today, Germany will release reports on unemployment and unemployment claims, while the US docket will feature a more or less important JOLTs report on the number of job openings in April.
1) Signal strength is determined by the time taken for its formation (either a bounce or level breach). A shorter formation time indicates a stronger signal.
2) If two or more trades around a certain level are initiated based on false signals, subsequent signals from that level should be disregarded.
3) In a flat market, any currency pair can produce multiple false signals or none at all. In any case, the flat trend is not the best condition for trading.
4) Trading activities are confined between the onset of the European session and mid-way through the U.S. session, after which all open trades should be manually closed.
5) On the 30-minute timeframe, trades based on MACD signals are only advisable amidst substantial volatility and an established trend, confirmed either by a trendline or trend channel.
6) If two levels lie closely together (ranging from 5 to 15 pips apart), they should be considered as a support or resistance zone.
Support and Resistance price levels can serve as targets when buying or selling. You can place Take Profit levels near them.
Red lines represent channels or trend lines, depicting the current market trend and indicating the preferable trading direction.
The MACD(14,22,3) indicator, encompassing both the histogram and signal line, acts as an auxiliary tool and can also be used as a signal source.
Significant speeches and reports (always noted in the news calendar) can profoundly influence the price dynamics. Hence, trading during their release calls for heightened caution. It may be reasonable to exit the market to prevent abrupt price reversals against the prevailing trend.
Beginners should always remember that not every trade will yield profit. Establishing a clear strategy coupled with sound money management is the cornerstone of sustained trading success.
Le recensioni analitiche di InstaForex ti renderanno pienamente consapevole delle tendenze del mercato! Essendo un cliente InstaForex, ti viene fornito un gran numero di servizi gratuiti per il trading efficiente.

