 Rimani
Condizioni di trading
Strumenti


EUR/USD went through a sharp, and once again, illogical rise of about 100 pips on Wednesday. This situation mirrors what happened a month ago when a minor decrease in inflation triggered a substantial drop in the US dollar. At that time, we mentioned that there was no solid basis for such a steep USD decline, and the same thing can be applied to yesterday's events. We want to emphasize that in this article, we are deliberately not considering the results of the Federal Reserve meeting and its impact on the currency market. We believe that traders' reactions can persist for a day after the meeting concludes, so any conclusions should be drawn no earlier than this afternoon.
In regards to the inflation report, strictly speaking, the market had a reason to sell the dollar on Wednesday, just not to this extent. Inflation in the US slowed to 3.3% in May, which does not significantly affect the Fed's prospects of easing monetary policy in the coming months. Therefore, such a strong market reaction is completely baffling to us. However, it is not surprising either. The market had already been selling euros and buying dollars for several days now. We even thought the pair had returned to a pattern of logical movements. But Wednesday showed us that we are still far from logic.
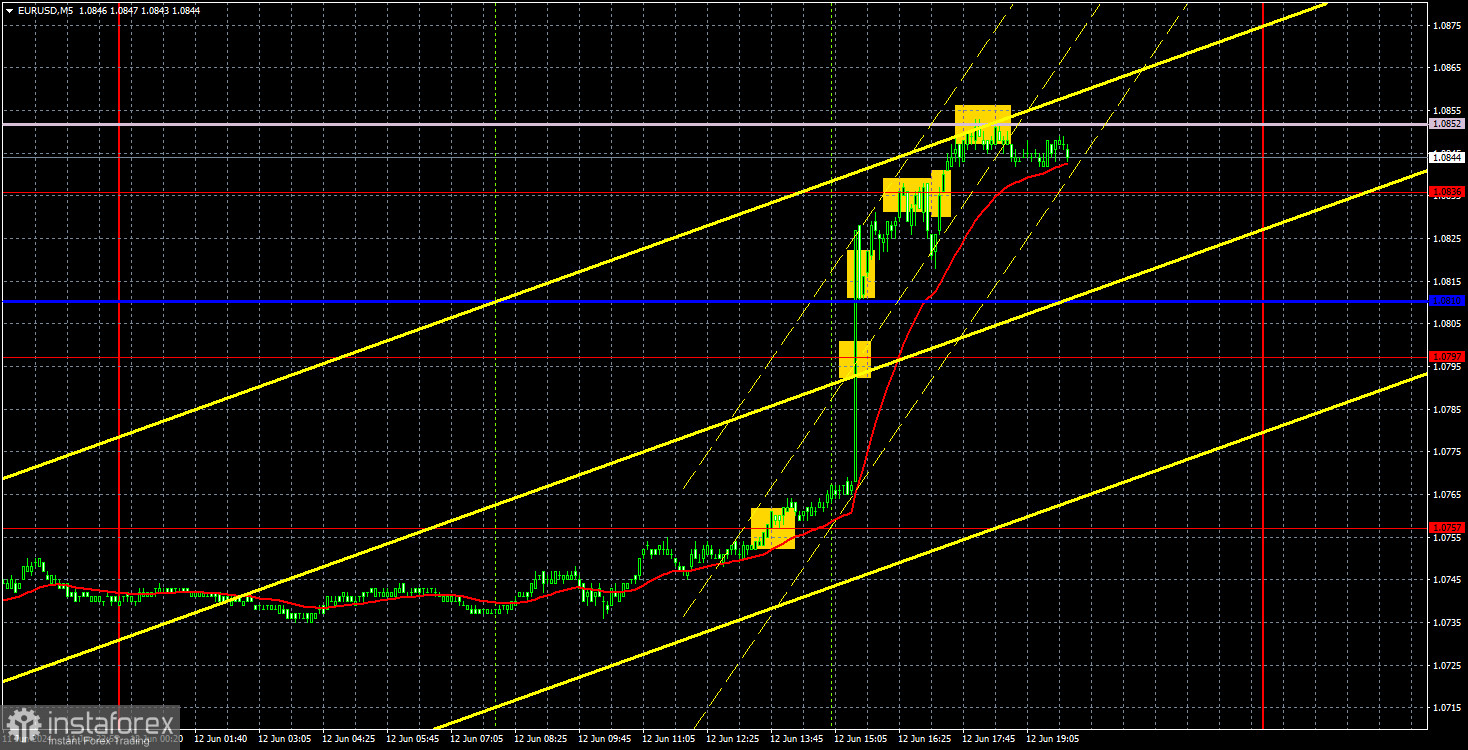
Despite the completely illogical movements, there was still a good opportunity to make profit from yesterday. Simply because the intraday movement was strong and there was a trend. A buy signal was formed during the European session when the price consolidated above the 1.0757 level. Afterwards, the pair rose to the 1.0836 level, and later to the Senkou Span B line. This was a good point to take profits, as it was better to exit the market before the Fed announced the results of its meeting. The profit from this trade amounted to about 70-80 pips.
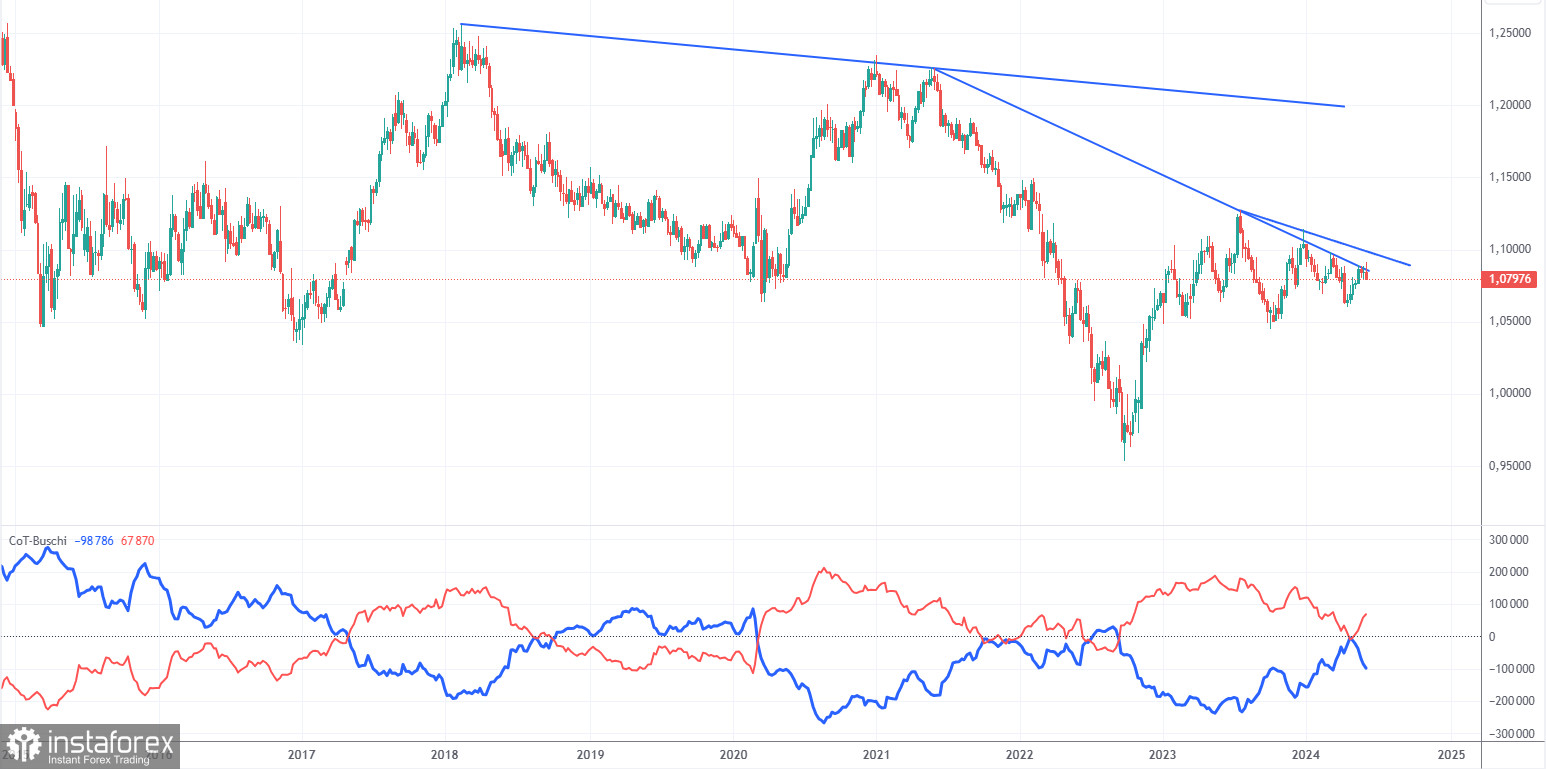
The latest COT report is dated June 4. The net position of non-commercial traders has remained bullish for a long time, and we're still dealing with the same situation. The bears' attempt to gain dominance failed spectacularly. The net position of non-commercial traders (red line) has been decreasing in recent months, while that of commercial traders (blue line) has been increasing. However, we are now observing the opposite trend again. This indicates that buyers, not sellers, are gaining momentum once again. This might be a temporary phenomenon since the downward trend is still relevant.
We don't see any fundamental factors that can support the euro's strength in the long term, while technical analysis also suggests a continuation of the downtrend. Three descending trend lines on the weekly chart suggests that there's a good chance of further decline.
Currently, the red and blue lines are diverging again, which indicates that long positions for the euro have increased. During the last reporting week, the number of long positions for the non-commercial group increased by 4,300, while the number of short positions decreased by 6,000. Accordingly, the net position increased by 10,300. Nonetheless, the European Central Bank's decision to lower rates and strong US Nonfarm Payrolls may initiate a new wave of decline for the euro.
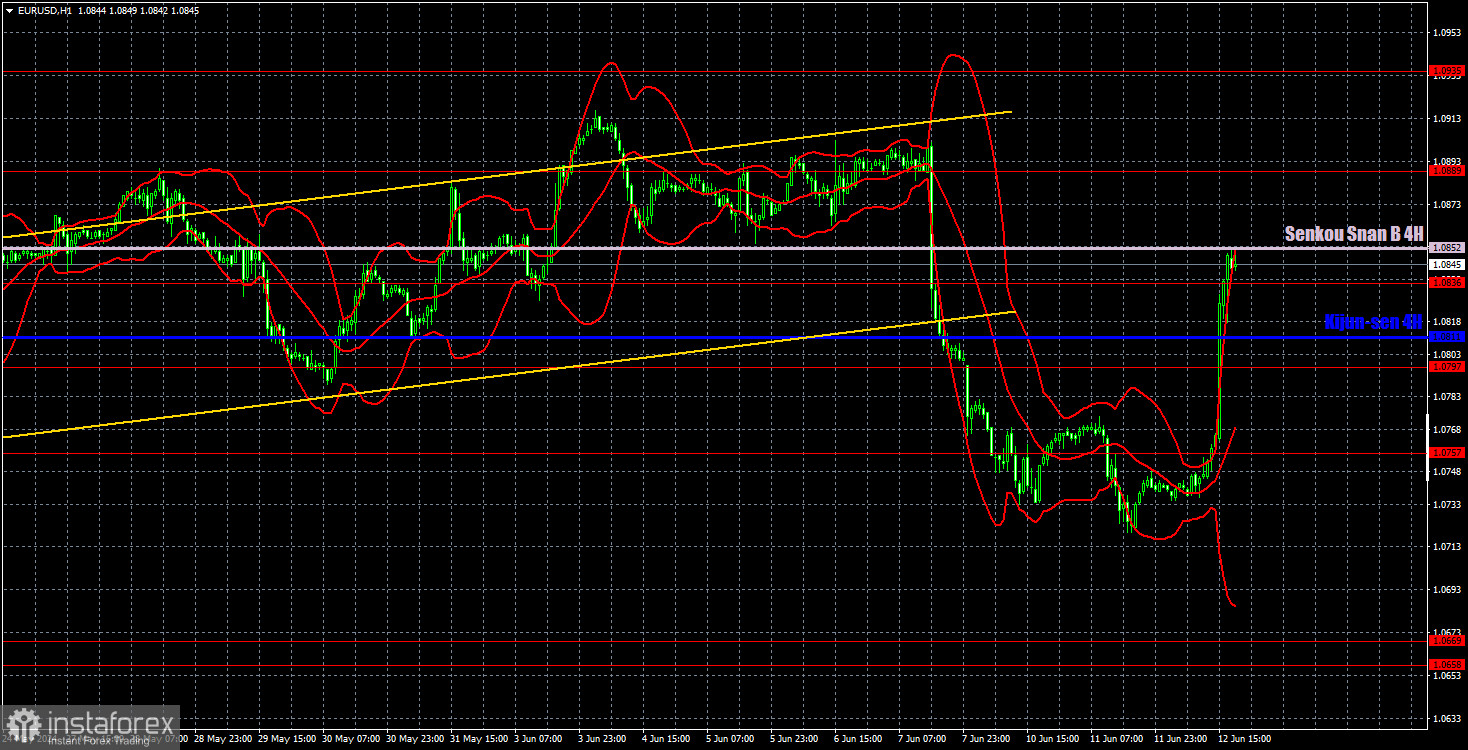
On the 1-hour chart, the EUR/USD pair finally has a real chance to form a new downward trend, but it could also lose this opportunity. As before, we still expect the euro to fall, but yesterday the market returned to selling the dollar. If the price consolidates above the Senkou Span B line, the downtrend will be canceled, and the pair might fluctuate in different directions for several days. In any case, it will be challenging to trade the pair in the coming days.
On June 13, we highlight the following levels for trading: 1.0530, 1.0581, 1.0658-1.0669, 1.0757, 1.0797, 1.0836, 1.0889, 1.0935, 1.1006, 1.1092, as well as the Senkou Span B (1.0852) and Kijun-sen (1.0811) lines. The Ichimoku indicator lines can move during the day, so this should be taken into account when identifying trading signals. Don't forget to set a Stop Loss to breakeven if the price has moved in the intended direction by 15 pips. This will protect you against potential losses if the signal turns out to be false.
On Thursday, the European Union will publish a report on industrial production. The US docket will feature reports on jobless claims and producer prices. All three reports can be considered secondary, and the market may spend half the day reacting to the results of the Fed meeting and Jerome Powell's speech.
Support and resistance levels are thick red lines near which the trend may end. They do not provide trading signals;
The Kijun-sen and Senkou Span B lines are the lines of the Ichimoku indicator, plotted to the 1H timeframe from the 4H one. They provide trading signals;
Extreme levels are thin red lines from which the price bounced earlier. They provide trading signals;
Yellow lines are trend lines, trend channels, and any other technical patterns;
Indicator 1 on the COT charts is the net position size for each category of traders;
Le recensioni analitiche di InstaForex ti renderanno pienamente consapevole delle tendenze del mercato! Essendo un cliente InstaForex, ti viene fornito un gran numero di servizi gratuiti per il trading efficiente.


